
What is abandonment rate?
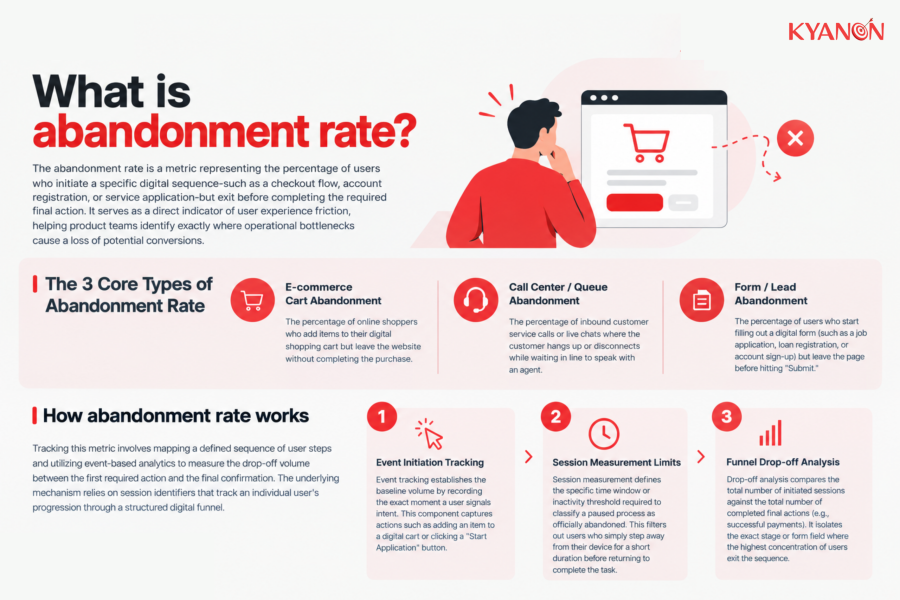
The abandonment rate is a metric representing the percentage of users who initiate a specific digital sequence-such as a checkout flow, account registration, or service application-but exit before completing the required final action. It serves as a direct indicator of user experience friction, helping product teams identify exactly where operational bottlenecks cause a loss in potential conversions.
The 3 Core Types of Abandonment Rate
- E-commerce Cart Abandonment: The percentage of online shoppers who add items to their digital shopping cart but leave the website without completing the purchase.
- Call Center / Queue Abandonment: The percentage of inbound customer service calls or live chats where the customer hangs up or disconnects while waiting in line to speak with an agent.
- Form / Lead Abandonment: The percentage of users who start filling out a digital form (such as a job application, loan registration, or account sign-up) but leave the page before hitting “Submit.”

How abandonment rate works
Tracking this metric involves mapping a defined sequence of user steps and utilizing event-based analytics to measure the drop-off volume between the first required action and the final confirmation. The underlying mechanism relies on session identifiers that track an individual user’s progression through a structured digital funnel.
Event Initiation Tracking
Event tracking establishes the baseline volume by recording the exact moment a user signals intent. This component captures actions such as adding an item to a digital cart or clicking a “Start Application” button.
Session Measurement Limits
Session measurement defines the specific time window or inactivity threshold required to classify a paused process as officially abandoned. This filters out users who simply step away from their device for a short duration before returning to complete the task.
Funnel Drop-off Analysis
Drop-off analysis compares the total number of initiated sessions against the total number of completed final actions (e.g., successful payments). It isolates the exact stage or form field where the highest concentration of users exit the sequence.
Abandonment rate vs Bounce Rate
Both metrics measure user exits, but they differ entirely in user intent and process depth.
Dimension | Abandonment rate | Bounce Rate |
| Measurement scope | Multi-step processes and funnels | Single-page visits |
User intent level | High (User initiated an action) | Low (User arrived and left) |
| Funnel position | Middle to Bottom of Funnel | Top of Funnel |
Primary cause | UX friction, pricing, hidden terms | Irrelevant content, slow load times |
| Business impact | Direct loss of highly qualified revenue | Lost traffic and brand visibility |
When to consider abandonment rate
Consider abandonment rate if:
- Your analytics platforms show high traffic volume entering a multi-step registration form but failing to reach the final account confirmation page.
- Your transaction systems are processing significantly fewer payments than the volume of items actively added to user carts on a daily basis.
- Your call center queue logs indicate users consistently terminating calls within specific automated routing menus.
It may not be the right priority if:
- Your digital property consists entirely of single-page informational landing pages where users are expected to read content and leave without taking a sequential action.
Why abandonment rate matters for Enterprise Ecommerce
High abandonment across digital platforms indicates underlying UI friction that directly reduces total addressable revenue and increases customer acquisition costs (CAC). Systematically auditing these drop-off points allows product teams to streamline checkout architectures, reducing total cost of ownership (TCO) associated with managing fragmented or overly complex user flows.
Baymard’s 2026 data puts average documented ecommerce cart abandonment at 70.22%. More importantly, its research estimates that the average large ecommerce site could potentially achieve a 35.26% increase in conversion rate through checkout design improvements alone.
Common Misconceptions
Every abandoned cart means the user got frustrated and we need to completely redesign the checkout flow
Reality: Consumers frequently add items to a cart simply to check total costs, compare prices, or save items for payday. Treating these high-intent wishlist users as a broken checkout pipeline leads to aggressive, unnecessary site redesigns when the real solution is a well-timed retargeting strategy.
We need to drive our abandonment rate as close to 0% as possible by removing all form fields
Reality: Eliminating all friction can backfire entirely. Removing important account verification steps or strict fraud checks to lower form abandonment will successfully boost completion rates, but at the cost of flooding your CRM with low-quality leads, spam bots, and fraudulent transactions.
Users leave because the base price is too high, so we must immediately offer a discount
Reality: Abandonment is frequently driven by user experience friction, such as complicated account creation walls, unexpected delivery timelines, or a lack of preferred payment methods. Offering a coupon does not fix a fundamentally broken user interface.
How Kyanon Digital Applies abandonment rate
Kyanon Digital analyzes the abandonment rate for enterprise ecommerce and digital platform clients to identify UX and conversion optimization opportunities. We implement cross-channel tracking architectures for businesses across Vietnam, Singapore, Thailand, ANZ, and Malaysia. Our engineering teams focus on deep implementation, restructuring data pipelines to filter out “false abandons” and addressing the exact points of technical friction that prevent users from converting.
Explore our E-commerce services:

 Create project brief with AI