
What are experience metrics?
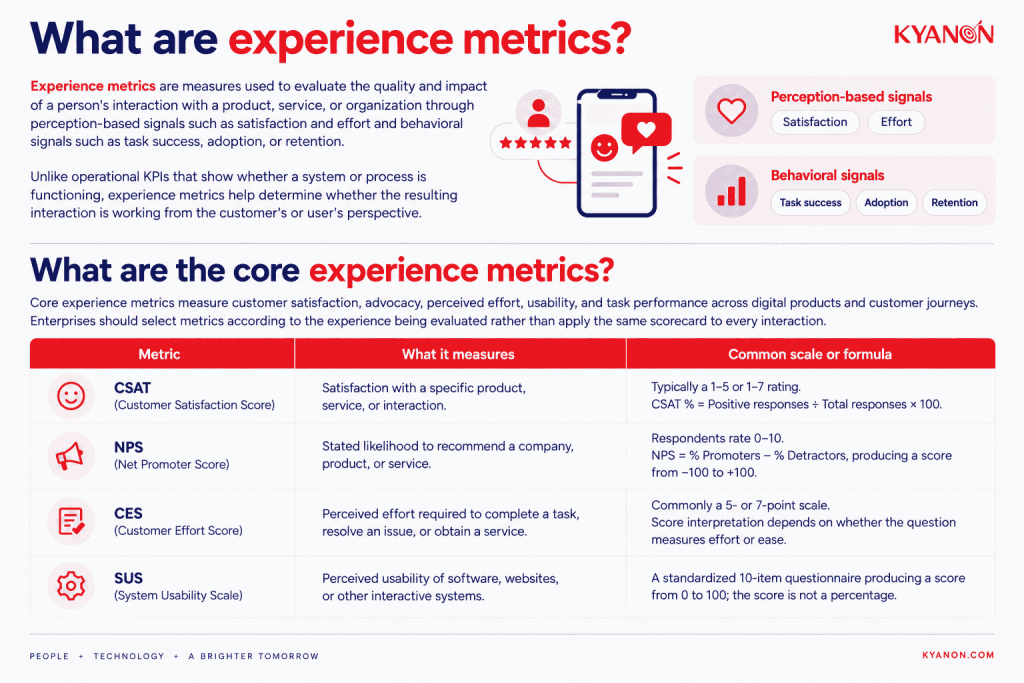
Experience metrics are measures used to evaluate the quality and impact of a person’s interaction with a product, service, or organization through perception-based signals such as satisfaction and effort and behavioral signals such as task success, adoption, or retention.
Unlike operational KPIs that show whether a system or process is functioning, experience metrics help determine whether the resulting interaction is working from the customer’s or user’s perspective. Qualtrics distinguishes experience measures from operational measures by describing experience data as evidence of how people think and feel about interactions with an organization.
What are the core experience metrics?
Core experience metrics measure customer satisfaction, advocacy, perceived effort, usability, and task performance across digital products and customer journeys. Enterprises should select metrics according to the experience being evaluated rather than apply the same scorecard to every interaction.
Core experience metrics (CX / UX)
Metric | What it measures | Common scale / formula |
CSAT (Customer Satisfaction Score) | Satisfaction with a specific product, service, or interaction. | Typically a 1–5 or 1–7 rating. CSAT % = Positive responses ÷ Total responses × 100. |
| NPS (Net Promoter Score) | Stated likelihood to recommend a company, product, or service. | Respondents rate 0–10. NPS = % Promoters − % Detractors, producing a score from −100 to +100. |
CES (Customer Effort Score) | Perceived effort required to complete a task, resolve an issue, or obtain a service. | Commonly a 5- or 7-point scale. Score interpretation depends on whether the question measures effort or ease. |
| SUS (System Usability Scale) | Perceived usability of software, websites, or other interactive systems. | A standardized 10-item questionnaire producing a score from 0 to 100; the score is not a percentage. |
Usability and behavioral metrics
Usability and behavioral metrics measure whether users can complete intended tasks, how much time those tasks require, and where interaction errors occur. They provide observable evidence that complements customers’ self-reported perceptions.
| Metric | What it measures | Common scale / formula |
Task Completion Rate | Percentage of users who successfully complete a defined task. | Successful task completions ÷ Total task attempts × 100. |
| Time on Task | Time required to complete a defined task or journey step. | Seconds or minutes per attempt; typically reported as a median or another defined summary statistic. |
Error Rate | Frequency of user errors during an interaction or task. | Errors per task attempt, or attempts with errors ÷ Total attempts × 100. |
These metrics should be interpreted together. For example, reducing time on task does not necessarily indicate a better experience if task completion also declines.
First Response Time (FRT) is a related operational metric that measures the time between a customer support request and the first agent response. It is typically reported in seconds, minutes, or hours and should be analyzed alongside CSAT or CES to determine whether faster responses correspond with a better customer experience.

How experience metrics work
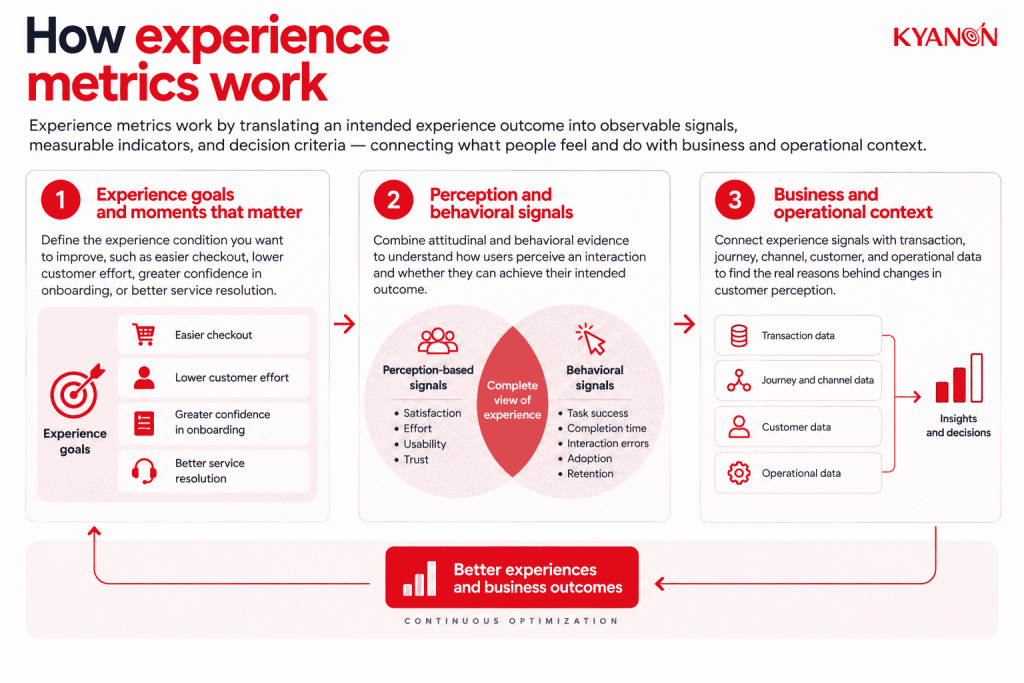
Experience metrics translate product goals into observable signals and measurable indicators. Google’s Goals-Signals-Metrics process connects these elements to help product teams evaluate user experience and make informed product decisions.
An enterprise measurement model usually combines what people report, what they do, and what happens commercially or operationally. The objective is not to create the largest dashboard; it is to establish enough evidence to determine whether a particular journey, product, or service is improving.
Experience goals and moments that matter
Measurement starts by defining the experience condition the organization is trying to improve, such as easier checkout, lower customer effort, greater confidence in onboarding, or better service resolution.
This prevents teams from treating available telemetry as automatically meaningful. A metric is useful when leadership can explain what experience objective it represents and what decision would change if the metric moves.
Perception and behavioral signals
Experience measurement combines attitudinal and behavioral evidence to evaluate how users perceive an interaction and whether they can achieve their intended outcome.
Perception-based metrics capture satisfaction, effort, and usability, while behavioral metrics reveal task success, completion time, and interaction errors. Together, these signals help organizations identify experience gaps that neither feedback nor behavioral analytics can explain independently.
Business and operational context
Experience metrics become more actionable when they are connected to transaction, journey, channel, customer, and operational data.
For example, declining checkout satisfaction can be analyzed alongside abandonment, page performance, payment errors, order completion, and customer segment data. The combination allows teams to investigate whether a change in customer perception corresponds with a system issue, journey-design issue, or commercial outcome.
Experience metrics vs. operational metrics
Experience metrics measure the quality of an interaction from the human perspective, while operational metrics measure the performance of the systems and processes delivering that interaction. An enterprise measurement framework normally needs both because operational performance does not by itself prove that customers perceive the experience positively.
Dimension | Experience metrics | Operational metrics |
Primary question | How did the customer or user experience the interaction? | How did the system or process perform? |
| Primary focus | Perception, effort, satisfaction, behavior and experience outcomes | Speed, volume, availability, throughput, errors and process efficiency |
Typical data sources | Surveys, feedback, journey analytics, usability data and behavioral analytics | Application logs, CRM, ERP, service systems, infrastructure and process records |
| Examples | CSAT, NPS, CES, task success, perceived ease, retention | Response time, SLA attainment, uptime, ticket volume, processing time |
Unit of analysis | Customer, user, journey, touchpoint, task or experience | System, transaction, process, queue or operational function |
| Interpretation | Requires context about user expectations and behavior | Usually interpreted against technical or process thresholds |
Decision use | Experience design, journey optimization, product priorities and service improvement | Capacity planning, incident management, process control and system optimization |
| Main measurement risk | Treating one score as the complete experience | Assuming healthy operational KPIs mean customers are having a good experience |
A checkout system can meet its availability and latency targets while customers still perceive the journey as confusing or difficult. Conversely, a slower interaction may not be problematic if customers can complete an important task with greater confidence and fewer errors.
When to consider experience metrics
Experience metrics become relevant when leadership needs to determine whether technology, journey, or service changes are improving the experience people actually receive rather than only improving internal process KPIs.
Consider experience metrics if:
- Your operational KPIs look healthy but customer outcomes remain inconsistent. System availability, response times, or ticket closure rates may meet targets while satisfaction, conversion, adoption, or retention continue to deteriorate.
- You are redesigning a high-value customer journey. Commerce checkout, digital onboarding, loyalty, self-service, mobile applications, and support journeys need measurement criteria that show whether the redesigned experience improves customer effort and task outcomes.
- Customer feedback sits separately from transaction and journey data. Leadership may know the NPS or CSAT score but cannot determine which channel, product, journey stage, transaction, or customer segment is driving the result.
- Different teams use different definitions of experience success. Product, technology, commerce, marketing, and customer-service teams need a common measurement framework so that optimization decisions are not based on unrelated dashboards.
It may not be the right priority if:
- There is no clear decision or owner attached to the metric. Collecting additional experience data before defining the business question, measurement ownership, and response process is likely to increase reporting effort without improving decisions.
Experience measurement should therefore begin with the decision the organization needs to make, not with the number of metrics the analytics platform can collect.
Why experience metrics matter for digital commerce and customer experience
Experience metrics matter because customer perception can change commercial behavior even when the underlying transaction technically succeeds.
For an e-commerce or digital-experience leader, this means uptime, transaction success, release velocity, and page performance cannot be the only indicators used to evaluate a customer journey. They need to be connected with measures of effort, satisfaction, task success, abandonment, engagement, and downstream commercial behavior.
Google‘s original HEART framework was designed to measure user experience through multiple dimensions—happiness, engagement, adoption, retention, and task success, rather than relying on one universal score. The associated Goals-Signals-Metrics process links measurement directly to product goals and decisions.
A similar principle applies to enterprise digital commerce. In a retail loyalty platform transformation, Kyanon Digital implemented behavioral tracking across app launches, reward views, redemptions, notification responses, and conversion actions.
Outcome: The implementation established a foundation for customer behavior analysis, targeted campaigns, A/B testing, and continuous experience optimization. It enabled the retailer to make marketing decisions based on actual customer interactions rather than isolated engagement metrics.
The value of experience metrics therefore comes from connecting measurement to a defined decision and business outcome, not from increasing the number of indicators on a dashboard.
Explore more: Customer Loyalty Platform Transformation for Retail Brand
Common misconceptions about experience metrics
No single score, telemetry stream, or output metric can represent a multidimensional customer or user experience on its own. Current UX measurement research similarly treats action and attitudinal metrics as complementary rather than interchangeable.
“We already track NPS, so customer experience is covered.”
Reality: NPS measures one dimension of customer advocacy; it does not explain task success, effort, journey friction, product adoption, or the operational causes behind a score.
For a CTO or Head of E-commerce, NPS should therefore be treated as one signal inside a measurement framework, not as the enterprise definition of experience performance.
“If we instrument every interaction, we will understand the experience.”
Reality: More telemetry creates more observations, not necessarily more insight. Clicks, page views, events, API calls, token usage, and session duration become meaningful only when they are connected to a defined experience goal or hypothesis.
The measurement question should be “What decision will this metric inform?”, not “What else can the platform track?”
“Behavioral data is more reliable, so surveys and qualitative feedback are optional.”
Reality: Behavioral analytics can show that customers abandoned checkout, repeated an action, or stopped using a feature, but it may not explain the customer’s reason, expectation, or perception.
Experience measurement therefore benefits from combining behavioral evidence with attitudinal or qualitative evidence when the organization needs to diagnose why the behavior occurred. Research on task-based UX measurement likewise recommends combining action and attitude metrics.
“If operational performance improves, the customer experience improved.”
Reality: Faster response time, more tickets closed, more releases shipped, or higher system availability are outputs of an operating model; none independently demonstrate lower customer effort or greater satisfaction.
Leadership should connect operational improvements to an experience outcome before treating them as evidence of customer impact.
“One declining experience score means the transformation is failing.”
Reality: A score change without journey, segment, timing, sample, and behavioral context can produce the wrong executive conclusion.
Experience metrics should be analyzed as trends and relationships across customer segments, journey stages, behavioral outcomes, and operational changes rather than as isolated dashboard movements.
How Kyanon Digital applies experience metrics
Kyanon Digital establishes experience measurement frameworks that connect customer perception, behavioral signals, journey data, and operational context so enterprise teams can evaluate whether technology changes improve the experience customers actually receive.
The work can begin with customer journey discovery and experience goals, then define the signals and metrics required across digital channels. Measurement can combine CSAT, NPS, effort, or other feedback indicators with commerce events, behavioral analytics, CRM/CDP data, service interactions, transaction outcomes, and operational KPIs.
Kyanon Digital’s customer-experience capability also covers journey assessment, UX research and testing, system integration, data platforms, analytics, and continuous optimization, allowing measurement to be connected to the systems that generate and act on the data rather than remaining a standalone reporting layer.
For enterprise programs across Asia-Pacific and global markets, the objective is to establish a measurement model that links experience signals to specific technology and business decisions, from checkout optimization and loyalty engagement to digital-service journeys and platform modernization.
→ Explore Kyanon Digital’s customer experience services.

 Create project brief with AI