
What is NPS (net promoter score)?
NPS (net promoter score) is a survey metric calculated by subtracting the percentage of detractors from the percentage of promoters among valid responses to a 0–10 recommendation-likelihood question.
How NPS (net promoter score) works
NPS summarizes recommendation intent by grouping respondents and calculating a score from −100 to +100. Interpretation depends on who was invited, who responded, when the survey was sent, and whether it concerns the overall relationship or a specific interaction.
Question and sampling
Use a consistent recommendation question and appropriate invitation policy. Keep relational and transactional surveys distinguishable, and monitor whether response patterns underrepresent important customer groups.
Score calculation
Promoters answer 9–10, passives 7–8, and detractors 0–6. Calculate promoter percentage minus detractor percentage using all valid responses in the denominator; passives therefore remain part of the calculation.
Explanation and follow-up
Collect a reason for the score and connect it to relevant journey context. Review themes, assign action owners, and follow up where appropriate instead of interpreting the score as a diagnosis by itself.
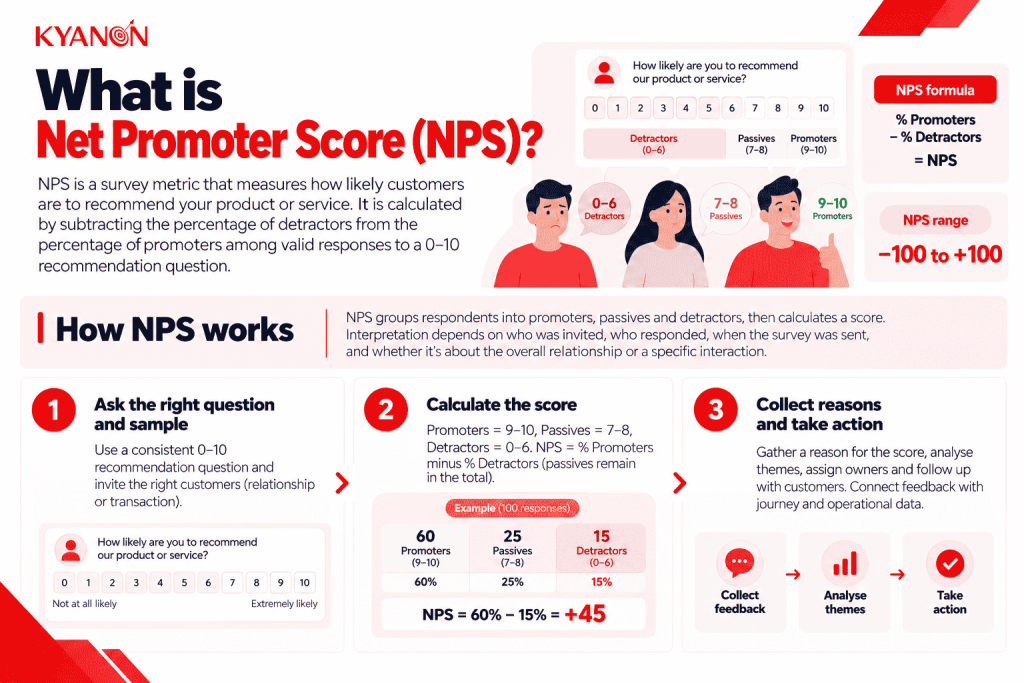

How do you calculate and interpret NPS?
For the standard 0–10 recommendation question, promoters score 9–10, passives 7–8, and detractors 0–6. NPS equals the percentage of promoters minus the percentage of detractors. Passives remain in the total-response denominator even though they are not directly subtracted.
Illustrative calculation: among 100 valid responses, 60 promoters, 25 passives and 15 detractors produce an NPS of +45. Report the score as points, not 45% satisfaction. The possible range is −100 to +100.
Interpret results alongside response rate, sample size, survey timing and customer mix. Relationship and transaction-triggered surveys answer different questions. Compare compatible populations over time, and investigate open-text reasons rather than treating a particular score as a universal definition of good CX.
NPS (net promoter score) vs. CSAT (customer satisfaction score)
NPS measures stated willingness to recommend; CSAT measures satisfaction with a defined experience, product, or interaction.
Dimension | NPS (Net Promoter Score) | CSAT (Customer Satisfaction Score) |
Core question | How likely are you to recommend? | How satisfied were you? |
| Usual scale | 0–10 recommendation scale | Varies, often a satisfaction rating scale |
Calculation | Promoter percentage minus detractor percentage | Defined satisfied responses or average rating |
| Typical use | Relationship and advocacy tracking | Specific experience feedback |
Main limitation | Does not explain causes or prove loyalty | Depends strongly on question and timing |
When to consider NPS (net promoter score)
Consider NPS (net promoter score) when the following conditions affect customer outcomes or operational control:
- Leadership needs a consistent way to monitor recommendation intent over time
- A customer feedback program can connect scores with reasons and accountable follow-up
- You need to compare relevant customer segments under a consistent survey method
It may not be the right priority if:
NPS should not replace direct task or service measures when the immediate question is whether a process works. Do not launch a survey without a plan to interpret and act on feedback.
Why NPS matters for customer experience measurement
NPS provides a compact way to track stated recommendation intent, but the score alone does not explain what customers experienced or what the organization should change.
For example, if detractors repeatedly mention billing problems, teams can compare that feedback with payment failures, support contacts, and account data to investigate the underlying issue.
The value therefore comes from connecting score → reason → customer context → operational evidence → action, rather than treating NPS as a standalone measure of customer experience.
Common misconceptions
“NPS is the average of our 0–10 ratings.”
Reality: NPS uses respondent categories and percentage subtraction, not the average rating. Two populations with similar averages can have different NPS results.
“A higher NPS proves our latest release increased loyalty.”
Reality: Survey composition, timing, and other changes can influence the score. Establish comparable samples and additional evidence before attributing movement to one release.
How Kyanon Digital applies NPS (net promoter score)
Kyanon Digital implements NPS measurement and analytics workflows that connect customer feedback with relevant operational and journey data. The work can include survey triggers, segmentation, dashboards, and follow-up ownership. This turns the score into an input for investigating experience problems and tracking improvement, rather than treating it as a standalone business outcome.
Explore Kyanon Digital’s Analyse & Augment services.

 Create project brief with AI