
What is Quantitative CX Research?
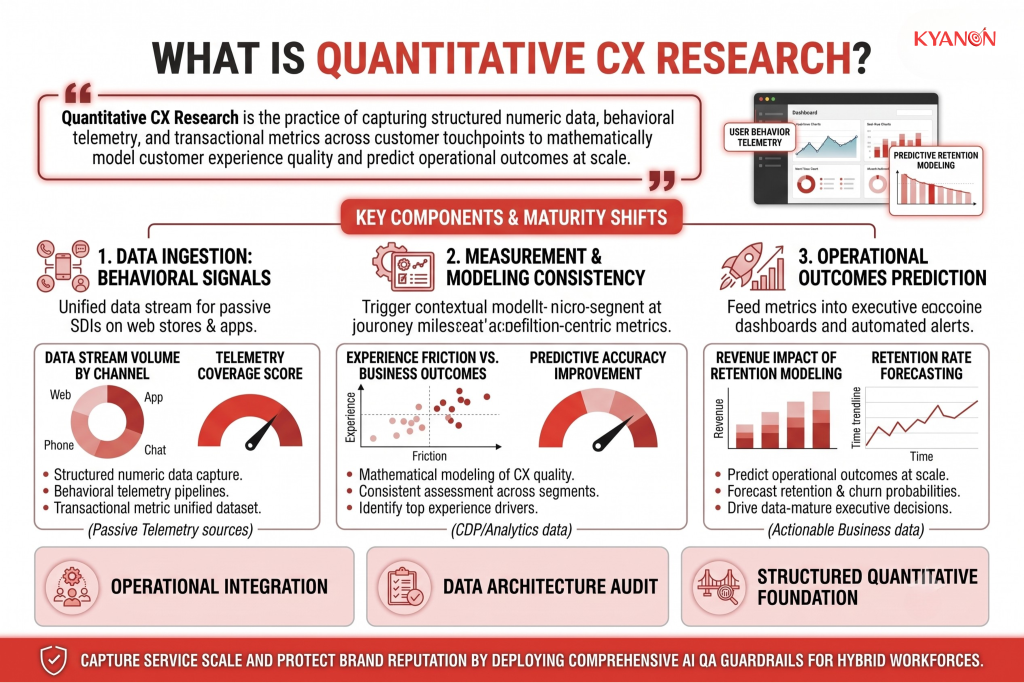
Quantitative CX Research is the practice of capturing structured numeric data, behavioral telemetry, and transactional metrics across customer touchpoints to mathematically model customer experience quality and predict operational outcomes at scale.
How Quantitative CX Research Works
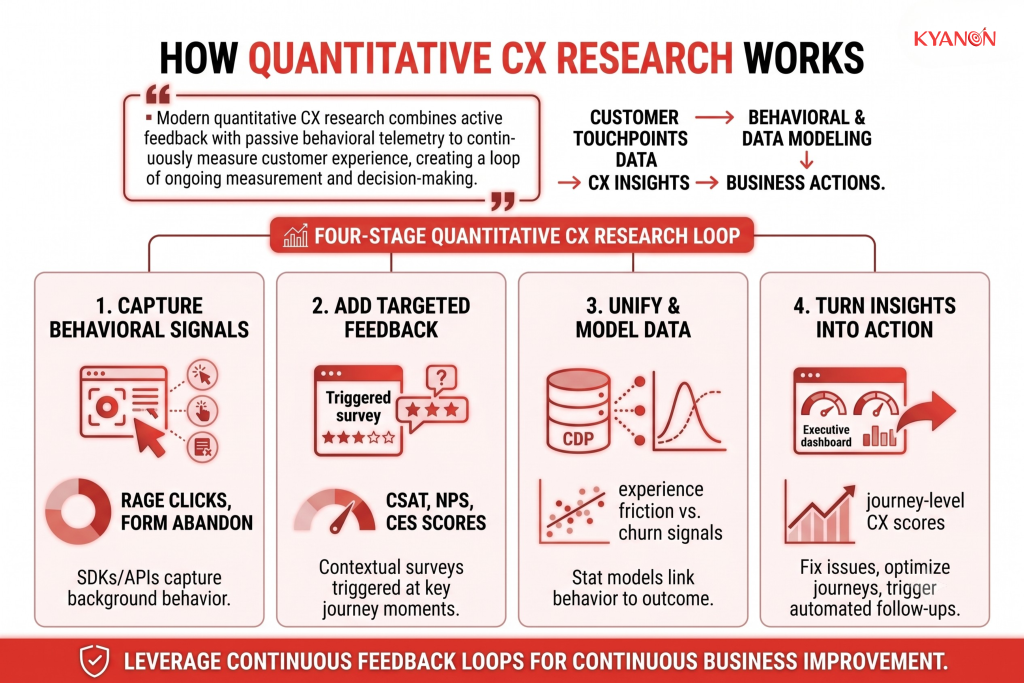
Modern quantitative CX research combines active customer feedback with passive behavioral telemetry to continuously measure and understand customer experience.
Instead of relying only on periodic surveys, businesses can combine what customers say with what they actually do across digital touchpoints. This creates a continuous view of CX performance and helps teams identify where experience friction is affecting business outcomes.
Capture Behavioral Signals
Digital touchpoints such as web stores, mobile apps, and customer portals collect interaction data through tracking SDKs and API listeners.
These technologies capture customer behavior in the background, helping businesses understand how users actually interact with digital experiences.
Typical signals include:
- Rage clicks: repeated clicks that may indicate frustration or a non-responsive interface
- Form abandonment: users starting but not completing a form
- Checkout latency: delays during the purchase or payment process
- Navigation paths: the steps customers take to complete a task
- Session and transaction events: key actions performed during a customer journey
From a CX perspective, passive telemetry shows where customers struggle or drop off without requiring them to explicitly report the problem.
Add Targeted Customer Feedback
Behavioral data is complemented by contextual micro-surveys such as CSAT, CES, and NPS.
Instead of surveying customers at random, these surveys can be triggered at specific journey milestones or after meaningful behaviors, such as completing a purchase, resolving a support issue, or abandoning a process.
This helps businesses understand not only what customers do, but also how they feel about the experience.
It also reduces survey fatigue by asking for feedback when it is most relevant.
Unify and Model the Data
Survey responses and behavioral telemetry can be unified in a Customer Data Platform (CDP) or analytics environment.
Statistical models can then identify relationships between:
- Experience friction
- Changes in customer behavior
- Conversion or churn signals
- Journey-level CX scores
For example, instead of simply identifying that customer satisfaction has declined, teams can investigate whether the decline is associated with checkout delays, complicated forms, or a specific journey step.
The business value is moving from “customers are dissatisfied” to “which experience factor is most strongly associated with the decline?”
Turn Insights Into Action
The resulting CX metrics can feed into executive dashboards, monitoring systems, and automated alerts.
When friction scores or operational metrics move beyond defined thresholds, teams can respond through:
- Engineering interventions to fix underlying experience issues
- Journey optimization to remove unnecessary steps or friction
- Targeted customer follow-ups based on specific behaviors
- Automated agent actions for defined CX scenarios
This creates a continuous research loop:
Capture → Measure → Model → Detect → Act
Instead of treating quantitative CX research as a periodic reporting exercise, businesses can use it as an ongoing feedback and decision-making system. The result is a clearer connection between customer behavior, experience quality, and business performance.

Comparative Analysis: Quantitative CX Research vs. Qualitative CX Research
Dimension | Quantitative CX Research | Qualitative CX Research | Business Impact |
| Primary Data Output | Numerical ratings, behavioral event streams, conversion rates | Interview transcripts, observational video, session recordings | Quant validates what is happening at scale; Qual reveals why users behave that way |
Sample Size & Scale | Large, statistically representative samples | Small, focused cohort groups | Quant ensures statistical significance; Qual provides deep contextual empathy |
| Collection Velocity | Real-time, continuous automated telemetry streaming | Periodic, labor-intensive manual study cycles | Continuous quantitative monitoring flags sudden operational degradation instantly |
Analysis Focus | Pattern isolation, regression modeling, baseline tracking | Root-cause discovery, usability barrier identification | Combining both prevents costly engineering investments based on unvalidated assumptions |
| Primary ROI Target | Churn reduction modeling, conversion funnel optimization | Product concept design, feature navigation overhauls | Drives measurable financial optimization while protecting user-centric feature design |
Why Quantitative CX Research Matters
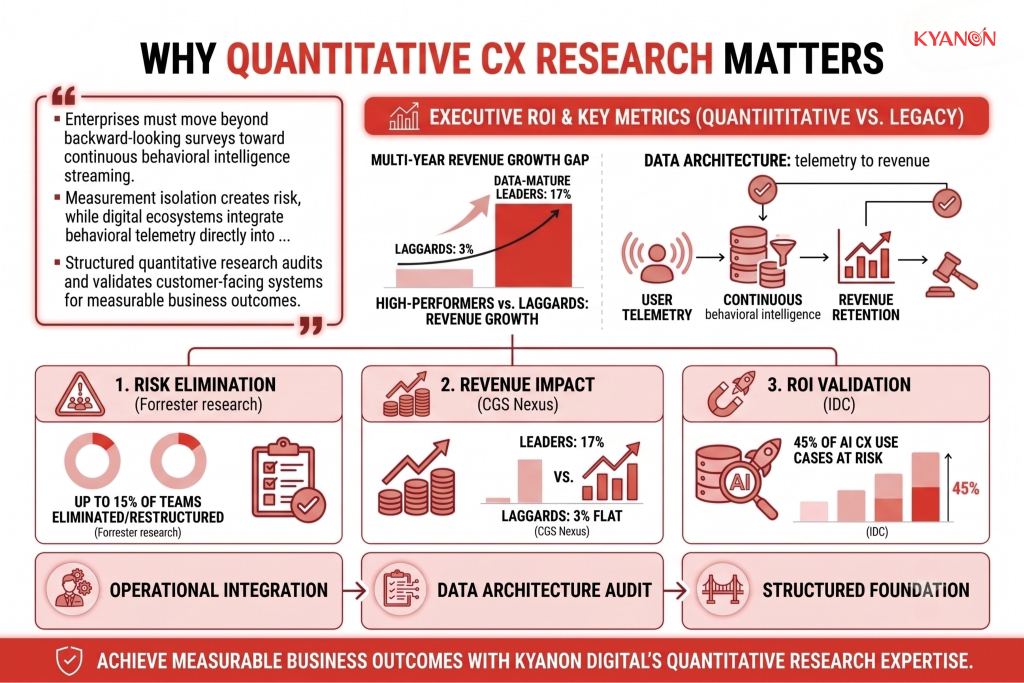
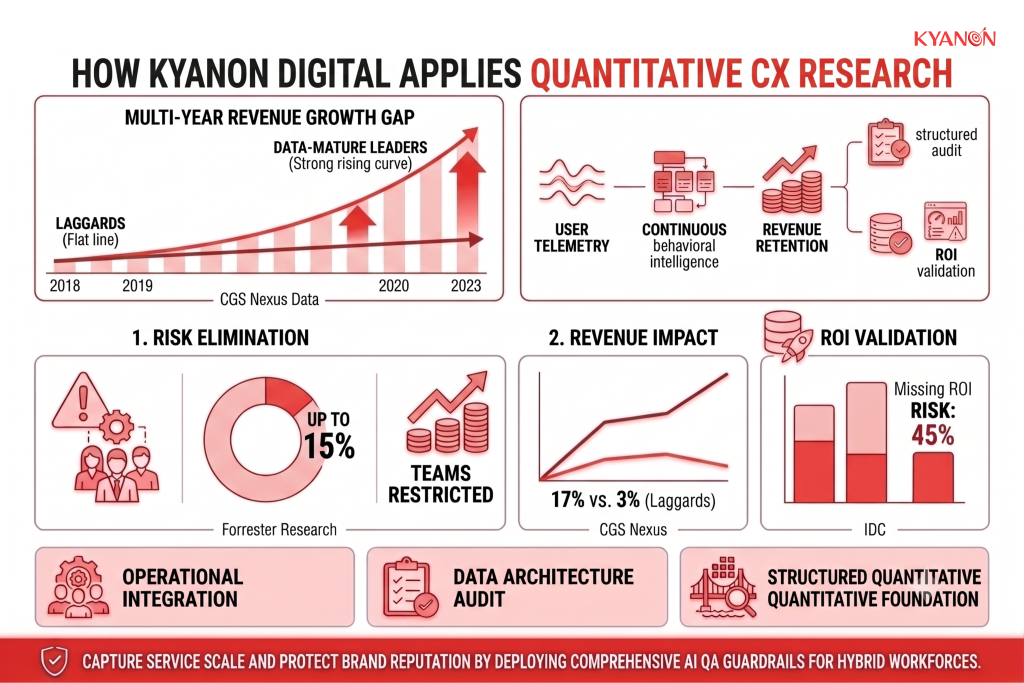
Enterprise customer experience strategies require moving beyond backward-looking survey dashboards toward continuous behavioral intelligence streaming. Over-indexing on superficial satisfaction benchmarks without operational integration creates severe structural vulnerabilities. According to research from Forrester, up to 15% of traditional customer experience teams risk being eliminated or restructured due to building reporting infrastructures that treat survey collection as the final mission rather than an actionable business driver.
To prevent measurement isolation, organizations are transitioning away from batch-processed survey evaluations to real-time data architectures. High-performing digital ecosystems integrate behavioral telemetry directly into core business operations to connect micro-level user friction with macro-level financial metrics. Research highlights the financial impact of this operational shift: CGS Nexus reports that high-performing CX leaders unlocked a 17% revenue growth rate over a multi-year horizon, compared to laggards whose revenue remained flat at 3%.
At the same time, expanding data pipelines requires robust analytics foundations to safeguard return on investment. Unifying disparate touchpoints across fragmented software stacks remains a major technical hurdle for digital enterprises. According to IDC, 45% of AI-fueled customer experience use cases face a risk of missing projected ROI benchmarks due to inadequate foundational data architectures, underscoring why structured quantitative research is essential to continuously audit and validate customer-facing systems.
Common Misconceptions
Quantitative research explains the root cause behind customer behavior
Quantitative data identifies what is occurring across user touchpoints, such as a 40% checkout drop-off rate, but rarely explains why. Discovering the underlying motivations or usability barriers behind the metrics requires pairing quantitative data streams with targeted qualitative methodologies like user interviews and usability testing.
High Net Promoter Scores guarantee customer happiness and retention
Survey scores are frequently distorted by metric inflation, politeness bias, or survey fatigue. A user may give a positive survey rating out of habit while actively preparing to migrate to a competitor due to pricing or missing features.
CX metrics automatically predict future financial performance
Customer experience metrics serve as leading indicators, but they do not guarantee revenue growth in isolation. Broader macroeconomic shifts, competitive pricing changes, or supply chain bottlenecks can offset high satisfaction scores and impact top-line financial performance.
Bigger sample sizes always mean better data quality
Collecting large volumes of data from an unrepresentative or poorly targeted audience yields mathematically precise, misleading results. Sample selection accuracy, representative cohort segmentation, and data cleanliness are far more critical to decision-making than raw sample size.
Customer surveys are the only way to gather quantitative CX data
Passive behavioral telemetry, including churn rates, application latency, click-stream paths, and average resolution times, often provides more reliable quantitative insights than self-reported survey answers, which are vulnerable to recall bias.
Statistical significance equals business significance
A 0.5% increase in satisfaction may prove statistically significant within a sample of one million users, but implementing the backend changes required to achieve it may cost significantly more than the incremental revenue generated.
Customer experience surveys should be sent as often as possible
Over-surveying degrades data quality by inducing survey fatigue, leading users to select random responses or abandon feedback prompts altogether. Modern measurement strategies prioritize passive behavioral tracking supplemented by micro-surveys triggered only by specific transactional milestones.
Quantitative CX research is a one-time project
Customer behavior and software ecosystems evolve continuously. Maintaining reliable insights requires continuous relational and transactional telemetry tracking to evaluate how ongoing product updates, pricing shifts, and operational adjustments impact user behavior over time.
How Kyanon Digital Applies Quantitative CX Research
Kyanon Digital conducts quantitative CX research for enterprise clients to validate UX hypotheses, benchmark digital products against competitors, and prioritize software development investments. We build real-time behavioral telemetry pipelines, configure Customer Data Platforms (CDPs), and execute data-driven conversion optimization programs to turn fragmented user interactions into clear business performance.
Explore our services:

 Create project brief with AI