
What is XAI Dashboard?
An XAI dashboard is a visual interface that transforms complex, black-box machine learning algorithms into transparent, regulatory-compliant, and auditable visual insights. It translates abstract mathematical scores into explicit, human-readable risk factors, ensuring financial institutions can deploy automated underwriting workflows without exposing the organization to unvetted systemic errors.
How XAI Dashboard works
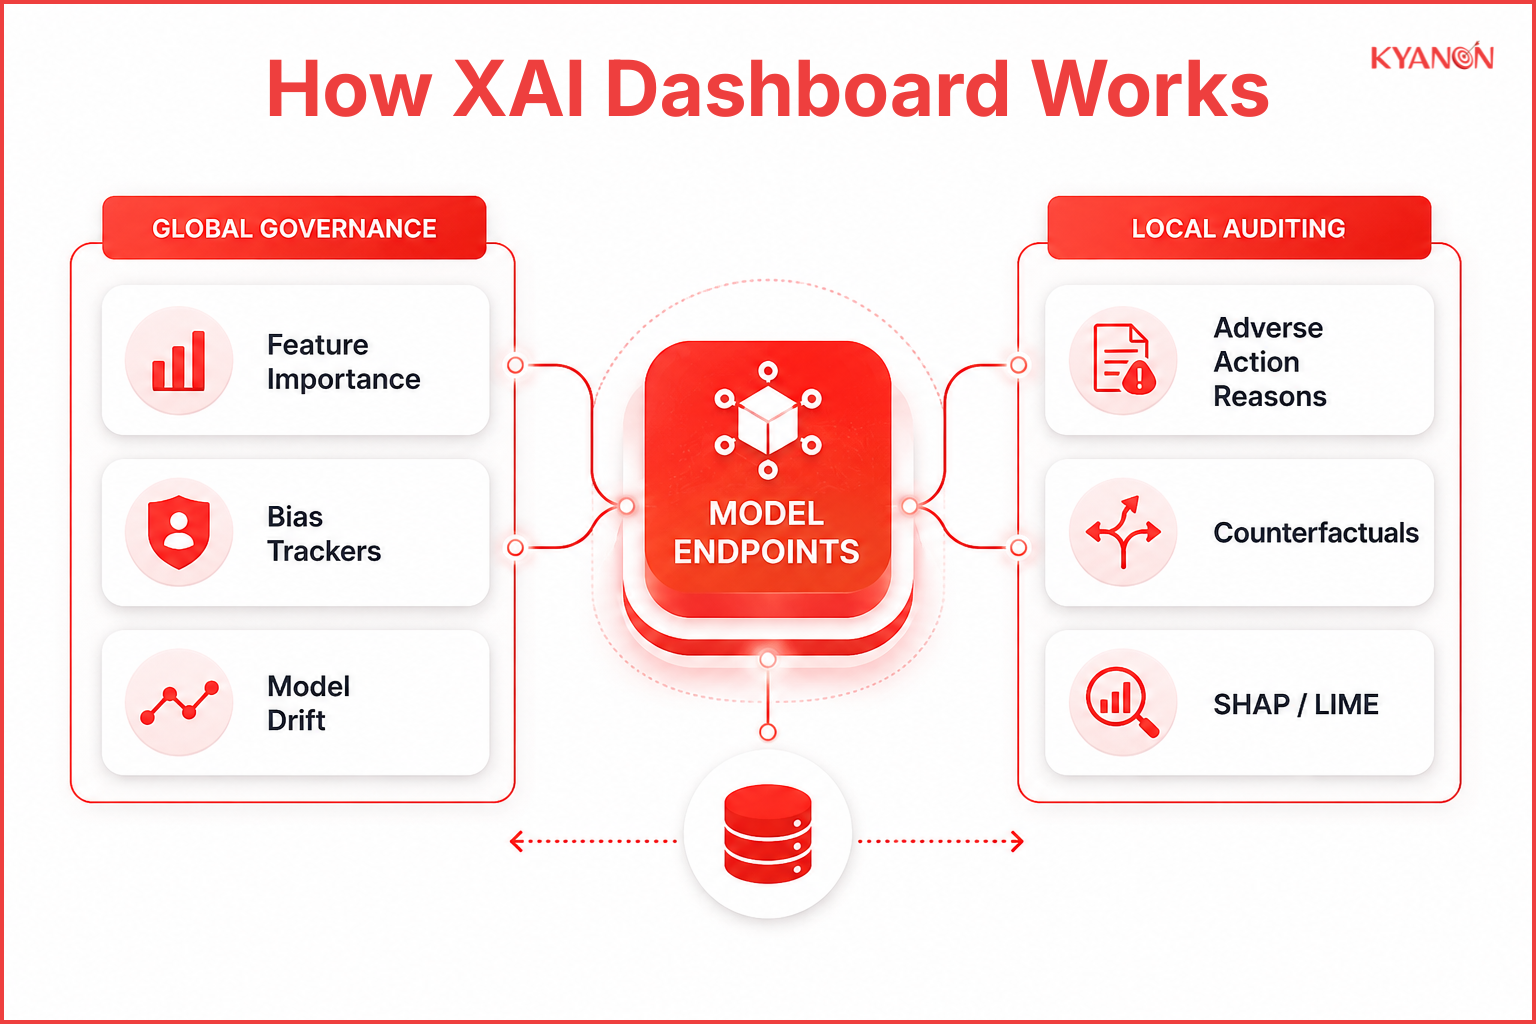
An XAI dashboard operates by splitting algorithmic telemetry into two functional operational layers: Global Governance and Local Auditing. The platform queries production model endpoints in real time, converting raw feature vectors and mathematical margins into standardized compliance reports and interactive simulation environments.
Global governance engine
This component tracks macro-level model health across the entire deployment lifecycle. It integrates real-time drift detection to alert risk officers if a feature weight, such as historical defaults, swings unexpectedly. Concurrently, it hosts fairness metrics monitors evaluating Disparate Impact and Equal Opportunity parameters while enforcing proxy variable isolation to ensure hidden demographic indicators like zip codes are not used to penalize vulnerable groups.
Local auditing framework
This localized utility isolates individual transactions to provide immediate post-hoc justifications for automated decisions. By leveraging instance-specific SHAP or LIME charts, it charts exactly how much each applicant characteristic pushed a score toward approval or denial. This framework automatically compiles the principal reasons for a loan denial, creating automated adverse action letters that directly satisfy regional compliance mandates.
Counterfactual “What-If” simulator
This interactive component provides human-in-the-loop override capabilities for borderline credit risk categories. It provides risk officers with interactive adjustment panels showing the exact minimum data changes, such as a specific reduction in an applicant’s debt-to-income ratio, required to safely flip a credit decision from a denial to an approval.

XAI Dashboard vs Conventional Data Telemetry Dashboard
An XAI dashboard diverges fundamentally from standard infrastructure monitoring tools by translating algorithmic logic instead of basic hardware performance.
Dimension | Conventional Data Telemetry Dashboard | XAI Dashboard |
| Primary Focus | Raw system performance and infrastructure metrics (e.g., latency, memory usage, uptime). | Algorithmic logic mapping, feature attribution scores, and prediction justifications. |
| Target Audience | DevOps engineers, system administrators, and core data science teams. | Risk managers, compliance auditors, business unit heads, and credit underwriters. |
| Interactivity Level | Static historical charts, logs, and point-in-time threshold alerts. | Dynamic “what-if” simulations and counterfactual scenario modeling. |
| Regulatory Compliance | Insufficient for mandates requiring explicit disclosures on automated logic. | Generates automated adverse action letters and reproducible audit trails. |
| Commercial Risk Mitigation | Mitigates infrastructure downtime, server bottlenecks, and hardware failures. | Eliminates hidden correlation errors, toxic loan build-ups, and regulatory fines. |
When to consider XAI Dashboard
Organizations must deploy an XAI dashboard when automated decision assets operate within high-stakes, legally audited environments where unverified errors yield severe financial or structural liability.
Consider XAI Dashboard if:
- Automated lending systems must comply with strict legal mandates such as the EU AI Act, GDPR, or the Fair Credit Reporting Act (FCRA).
- Underwriting models require reproducible audit trails that save a permanent snapshot of decision logic at the exact second a credit choice is made.
- Credit models risk performance degradation due to shifting macroeconomic indicators, requiring immediate alerts for model and operational drift.
- Deep learning or complex ensemble models (like LightGBM or XGBoost) require vetting to ensure they are not leveraging discriminatory proxy variables.
It may not be the right priority if:
- Your machine learning assets are limited to low-risk, internal recommendation pipelines or early-stage testing environments where outputs carry no legal, financial, or regulatory disclosure penalties.
Why XAI Dashboard matters for banking and insurance
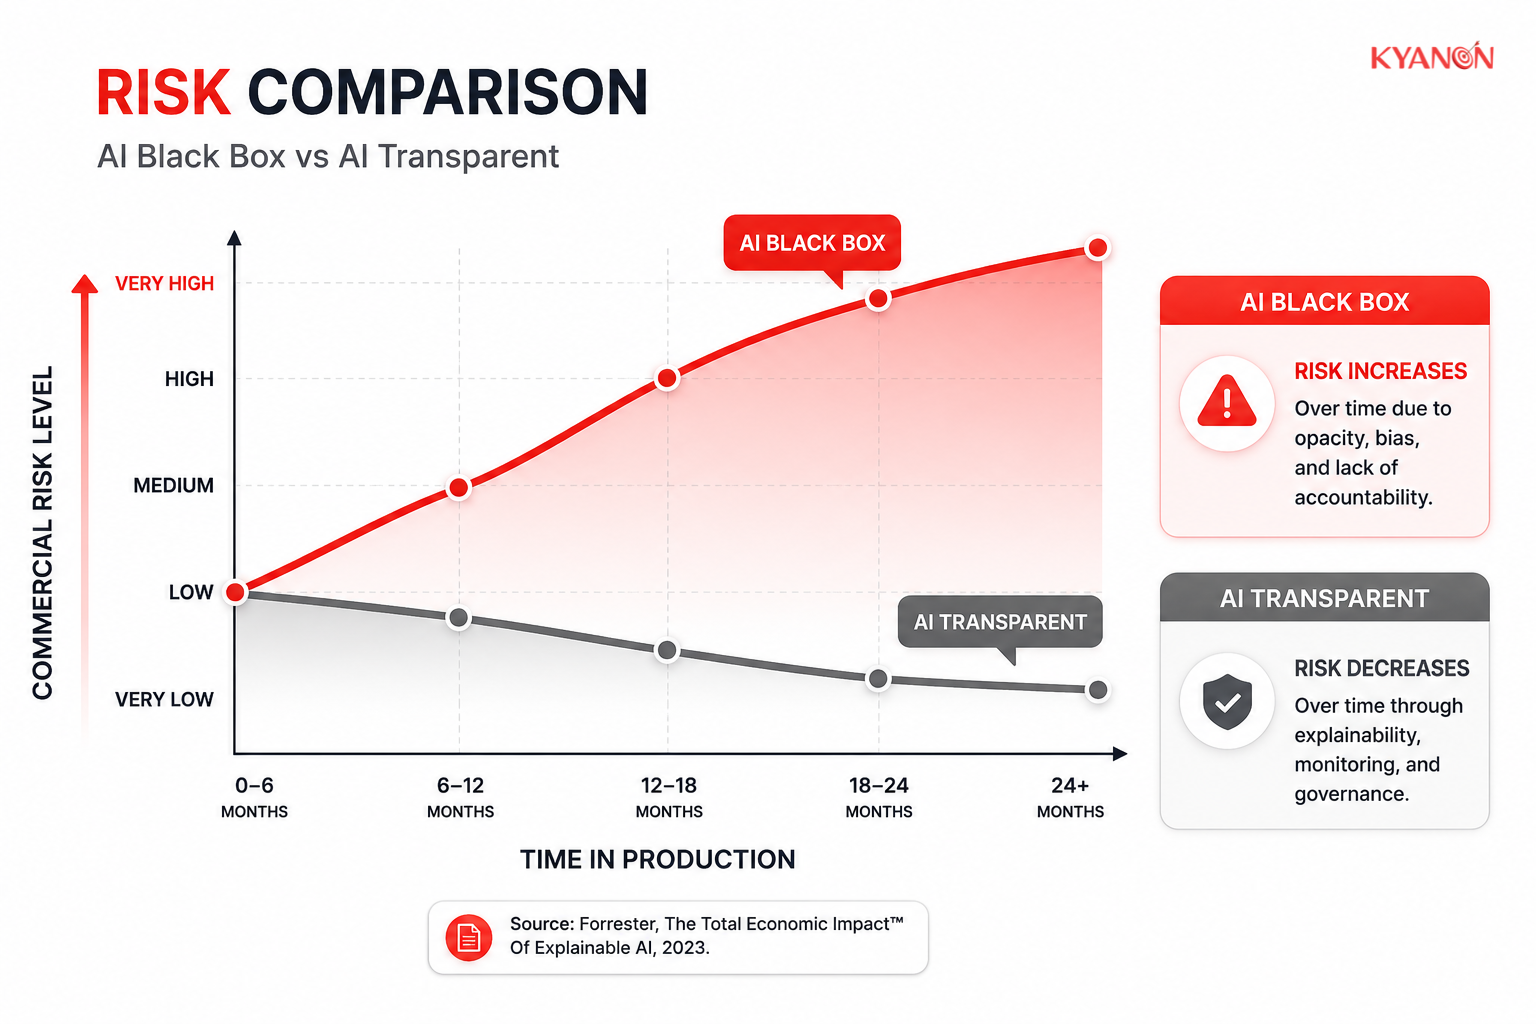
Within consumer finance, an XAI dashboard shifts risk management from a reactive post-mortem exercise to proactive asset governance. This transparency safeguards the institution’s balance sheet against toxic loan accumulation caused by hidden variable correlations.
Supporting evidence
According to the Forrester (2023) report, companies implementing structured model governance tools achieve up to a 50% reduction in time-to-compliance for automated systems. This efficiency directly impacts profitability by establishing zero-breach compliance pathways while protecting consumer brand equity through transparent appeals tracking.
A retail bank in Southeast Asia integrated an XAI credit interface into its automated underwriting pipeline to isolate fluctuating feature parameters during shifting macroeconomic periods. The platform successfully flagged corrupted input telemetry from external credit bureaus before it triggered erroneous mass auto-rejections, directly protecting regional market share and lowering asset default rates.
Common misconceptions
Deploying interpretability layers requires avoiding standard design traps that confuse technical transparency with actual operational utility.
“Visualizing raw mathematical explanations equals absolute systemic truth.”
Reality: Visual indicators like SHAP importance bars generate proxy approximations of a black-box model’s behavior rather than absolute ground truth. If unverified, these visual indicators can be unstable or unfaithful, creating a false sense of security while masking underlying model errors.
“One standardized dashboard design fits all enterprise stakeholders.”
Reality: Developers, compliance auditors, and business-focused risk officers require entirely different operational contexts. Flooding a credit underwriter’s interface with raw data science feature-weight gradients creates a cognitive burden, frequently resulting in complete dashboard abandonment.
How Kyanon Digital applies XAI Dashboard
Kyanon Digital builds and integrates custom XAI dashboards with core production models for banking, financial services, and insurance enterprises across Southeast Asia. Our implementations focus on embedding automated adverse action auditing, real-time fairness metrics, and counterfactual simulation modules into legacy underwriting environments. By aligning complex algorithmic telemetry with localized compliance frameworks, we transform black-box technical risks into transparent, auditable business outcomes.
→ Explore our AI Integration services











 Create project brief with AI