What is Z-Score Normalization?
Z-score normalization is a data preprocessing technique that transforms numerical features to a common scale with a mean of 0 and a standard deviation of 1 without altering the shape of the original distribution. This standardizes variables measured in entirely different units or ranges, such as comparing a patient’s blood pressure (mmHg) directly against their heart rate (bpm), ensuring that multi-feature machine learning models treat each variable with appropriate mathematical weight.
How Z-Score Normalization works
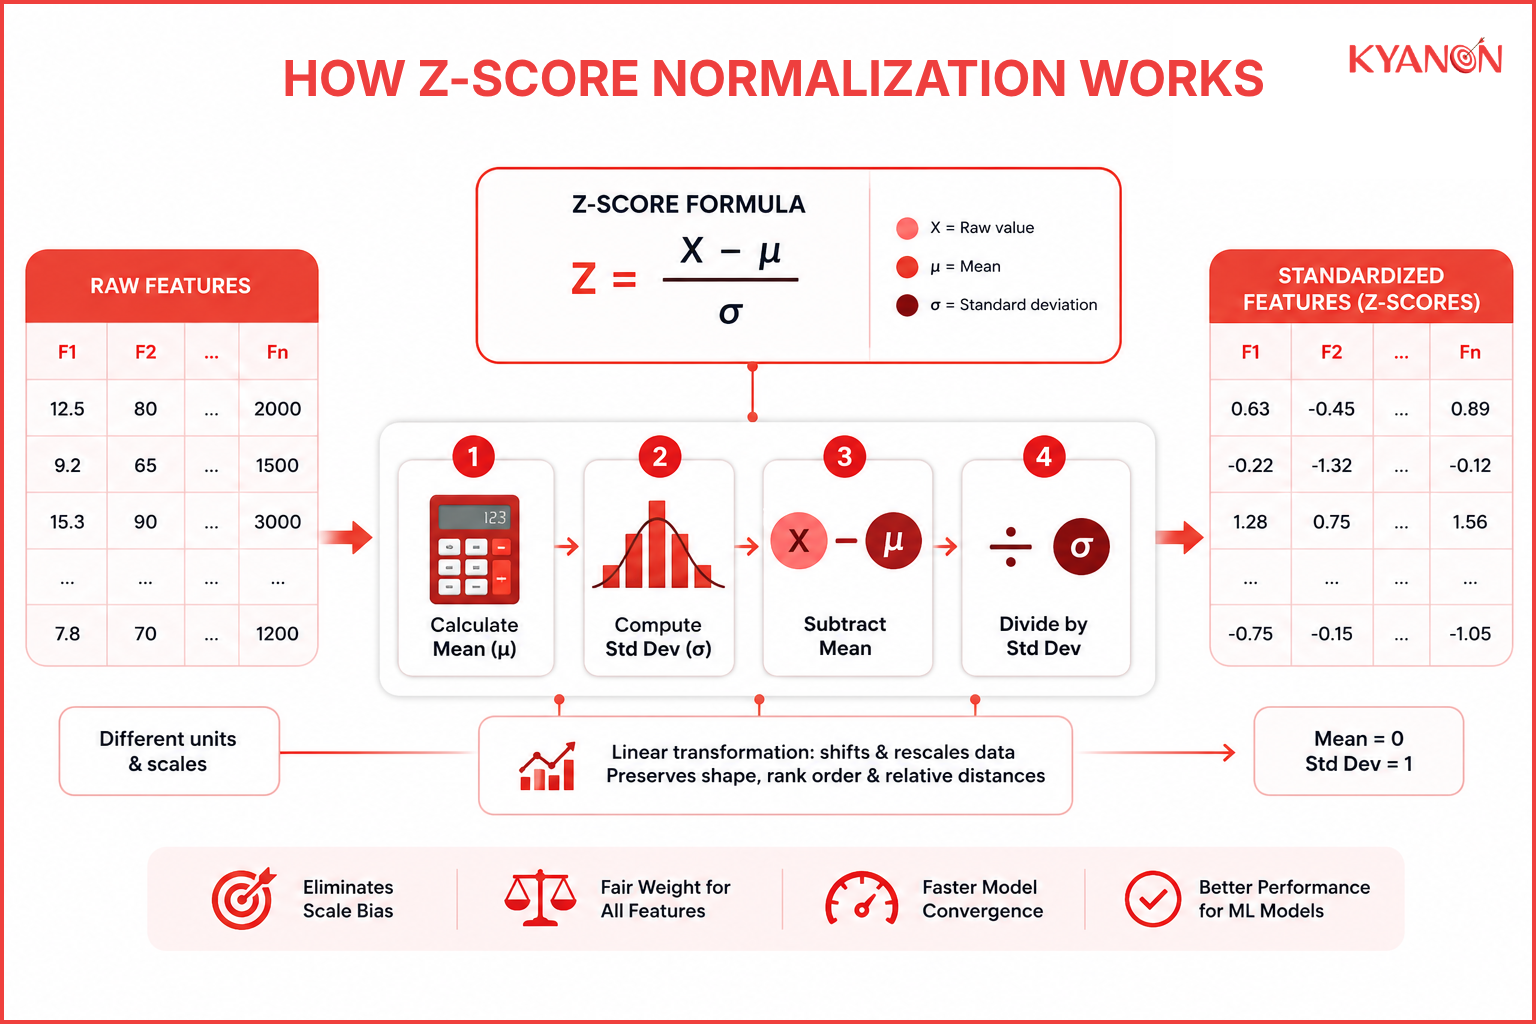
Z-score normalization operates by modifying each raw data point based on the collective statistical properties of its feature column. Because it relies on a linear function, the transformation alters the boundaries and overall scale of the dataset but strictly preserves the underlying shape, relative distances, and rank order of the distribution.
The core formula
The conversion of a raw data value into its standardized Z-score is calculated using a straightforward algebraic ratio, ensuring consistent rendering across all text editors:
Z = (x – μ) / σ
Where:
- Z is the final standardized score (Z-score).
- x is the original, raw data value.
- μ (Mu) is the arithmetic mean of the feature dataset.
- σ (Sigma) is the standard deviation of the feature dataset.
Step-by-Step execution pipeline
- Calculate the Dataset Mean (μ): Sum all numerical values within a specific feature column and divide by the total number of data points (N) to establish the average baseline.
- Compute the Standard Deviation (σ): Determine the average statistical distance of all data points from the calculated column mean to quantify the dataset’s variance.
- Subtract the Mean: For each raw value (x), subtract the calculated mean (μ), which shifts the center of the entire distribution to exactly 0.
- Divide by the Standard Deviation: Divide the resulting difference by the standard deviation (σ), compressing or expanding the spread into standard deviation units.
Programmatic implementation
To apply this mechanism programmatically within data engineering workflows, production pipelines utilize optimized libraries or spreadsheet architectures.
Python (Scikit-Learn)
Python
from sklearn.preprocessing import StandardScaler
# Initialize the scikit-learn standardizer
scaler = StandardScaler()
# Fit to the data and transform it into standardized scores
standardized_data = scaler.fit_transform(raw_data)
Microsoft Excel
Excel
=STANDARDIZE(A2, AVERAGE(A$2:A$100), STDEV.P(A$2:A$100))
Z-Score Normalization vs Min-Max Scaling
Both approaches adjust feature scales for machine learning models, but they differ in how they handle boundaries and underlying data variance.
| Dimension | Z-Score Normalization |
Min-Max Scaling |
|
Output range |
Theoretically unbounded (typically falls between -3 and 3) |
Strictly bounded (typically between 0 and 1) |
| Handling of outliers | Outliers alter variance calculations but remain distinctly visible within the dataset bounds |
Outliers compress normal data into a narrow window, reducing overall model resolution |
|
Preservation of variance |
Preserves the relative variance structure and distances of the dataset |
Restricts the original variance structure completely within a fixed boundary |
|
Best for |
Gradient descent and distance-based models (e.g., SVM, K-Means, PCA) |
Algorithms requiring strictly bounded inputs (e.g., Image processing, Neural networks) |
|
Mathematical baseline |
Grounded in the dataset mean and standard deviation |
Grounded in absolute minimum and maximum values |
When to consider Z-Score Normalization
Consider Z-Score Normalization if:
- Your data features possess entirely different scales or units of measurement, and you intend to deploy distance-dependent algorithms like K-Means Clustering, Support Vector Machines (SVM), Principal Component Analysis (PCA), or K-Nearest Neighbor.
- Your production machine learning architecture relies on gradient descent optimization, where uniform feature distribution minimizes the risk of structural oscillations and accelerates training convergence.
- Your data analytical models evaluate multi-variable inputs where no predefined minimum or maximum boundaries exist, requiring a scale based on overall statistical variance rather than fixed limits.
It may not be the right priority if:
- Your predictive modeling pipeline relies exclusively on tree-based algorithms, such as Random Forests or XGBoost, which evaluate split criteria independently per feature and derive zero operational benefit from linear scaling.
Why Z-Score Normalization matters for e-commerce
In enterprise e-commerce platforms, customer behavioral tracking generates highly asymmetrical data patterns, combining completely different metrics like total purchase value and click-through rates. Without normalizing these scales, predictive algorithms will inadvertently prioritize high-magnitude financial numbers over high-frequency engagement signals. Ensuring standard scaling across these data layers allows machine learning systems to produce unbiased customer segmentations, leading to accurate personalization strategies and optimized conversions.
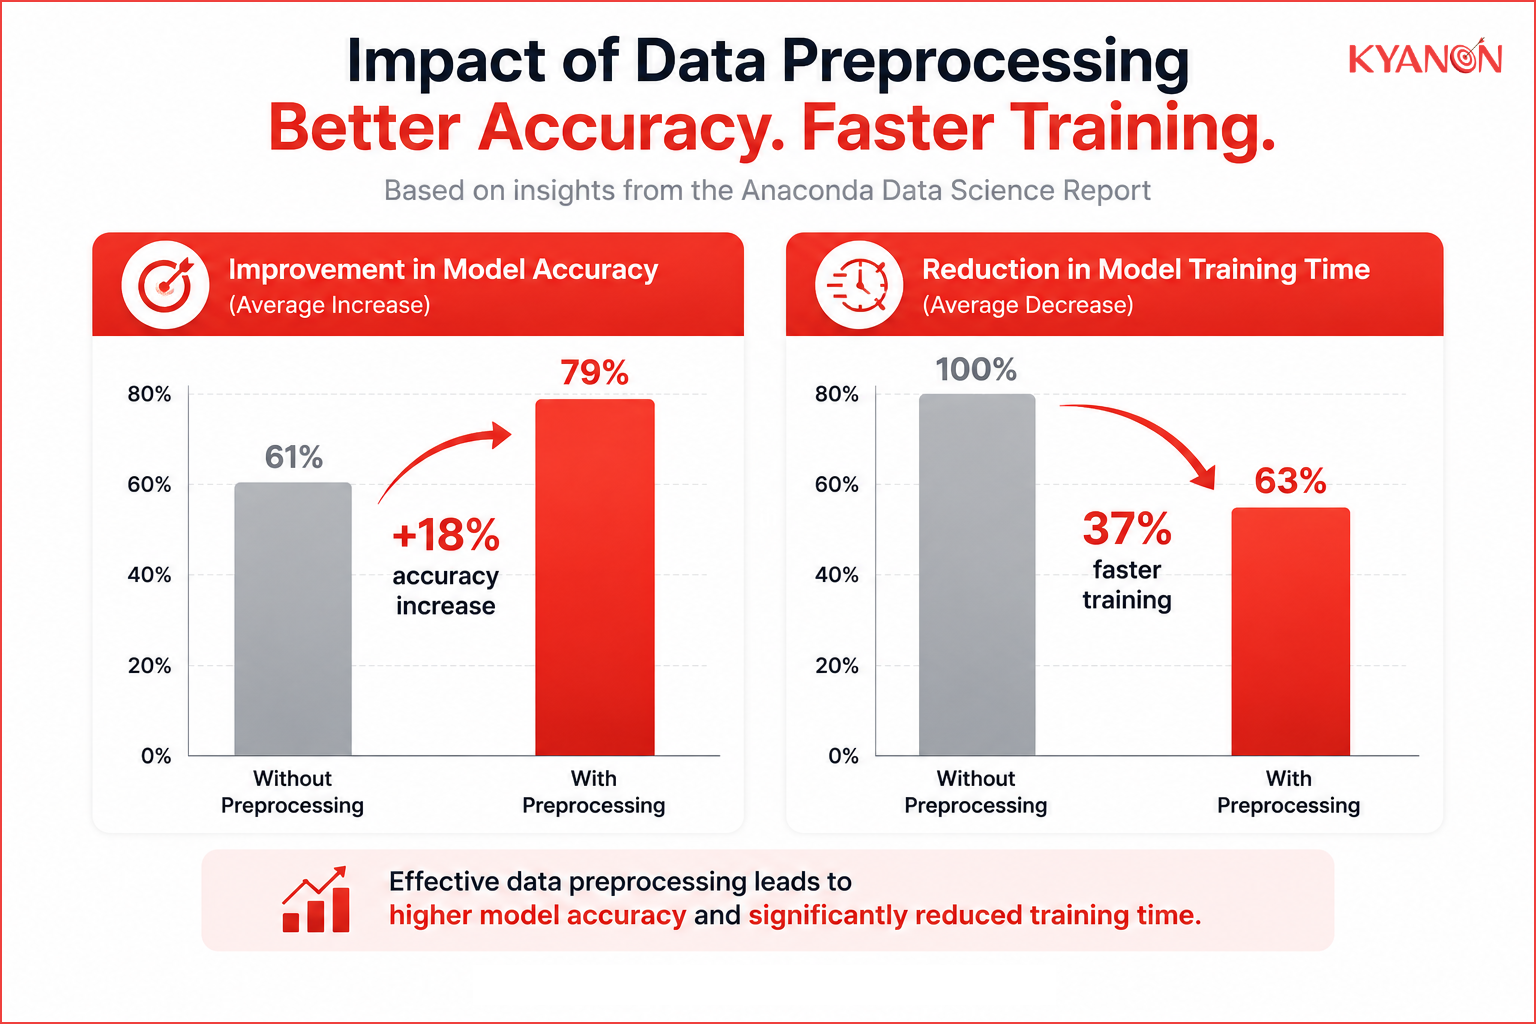
Supporting evidence
Data engineering frameworks prioritize feature scaling because multi-variable systems naturally experience mathematical drift when handling unnormalized inputs. According to the Scikit-Learn Data Preprocessing documentation, machine learning estimators can perform poorly if individual features do not closely mimic standard normally distributed data, as variables with larger variances will dominate the model’s objective function. Systematically implementing z-score normalization to anchor the dataset to a uniform variance successfully eliminates this scale bias, directly preserving the integrity and predictive reliability of downstream business intelligence and automation models.
Common misconceptions
“Z-score normalization transforms skewed data into a normal distribution.”
Reality: Z-score standardization is a purely linear equation that shifts and rescales data without altering its original distribution shape. If the underlying data is heavily skewed, bimodal, or uniform, it remains identically skewed, bimodal, or uniform after applying the formula.
“Standardizing data removes the need for outlier management.”
Reality: The calculations for both the mean and standard deviation are sensitive to extreme values. A single extreme outlier can inflate the standard deviation, squashing the standardized scores of all typical data points closer to zero and masking their actual variance.
How Kyanon Digital applies Z-Score Normalization
Kyanon Digital integrates automated z-score normalization directly into production-grade machine learning data preprocessing pipelines for enterprise retail and e-commerce clients across Southeast Asia. Our technical delivery focuses on embedding consistent feature scaling mechanisms within data pipelines to eliminate scale bias across multi-feature recommendation engines, predictive forecasting, and behavioral clustering models.
→ Explore our Machine Learning service


")


 Create project brief with AI