
What is journey analytics?
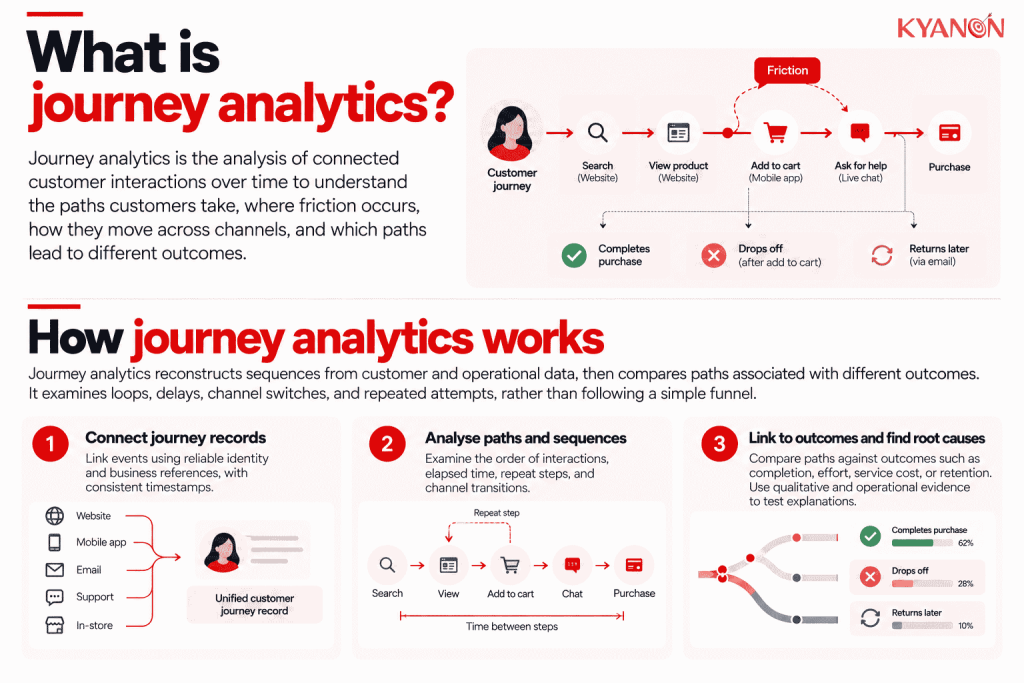
Journey analytics is the analysis of connected customer interactions over time to understand the paths customers take, where friction occurs, how they move across channels, and which paths lead to different outcomes.
Unlike analysis of an individual touchpoint, journey analytics examines the sequence between interactions. Its value comes from connecting customer behavior with enough identity, timing, channel, and outcome context to explain where a journey succeeds or breaks down.
How journey analytics works
Journey analytics reconstructs sequences from customer and operational data, then compares paths associated with different outcomes. It extends beyond a prescribed funnel by examining loops, delays, channel switches, and repeated attempts, subject to the limits of observed data.
Connected journey records
Link events using reliable identity and business references, with consistent timestamps. Document where offline activity, anonymous browsing, or missing integrations leave gaps in the observed journey.
Path and sequence analysis
Examine the order of interactions, elapsed time, repeat steps, and transitions. Define the journey boundary so unrelated activity is not combined into a misleading sequence.
Outcome and root-cause investigation
Compare paths against completion, effort, service cost, or retention. Use qualitative and operational evidence to test explanations because a path associated with churn does not automatically cause it.

How do you start a journey analytics project?
Choose a journey with a clear start and outcome, such as reporting a missing order and receiving a confirmed resolution. Map the events needed to observe it across commerce, delivery and support systems. State where identity is reliable and where paths remain anonymous or incomplete.
Compare successful and unsuccessful journeys by elapsed time, repeat steps, channel changes and customer outcome. A channel switch is not automatically a failure: it may be the customer’s preferred route. Investigate the context before proposing a fix. Assign one change to an accountable team and evaluate the result against the same journey definition. Journey analytics explains observed paths; it does not by itself prove why customers behaved that way or execute the next interaction.
How should businesses prioritize journey friction?
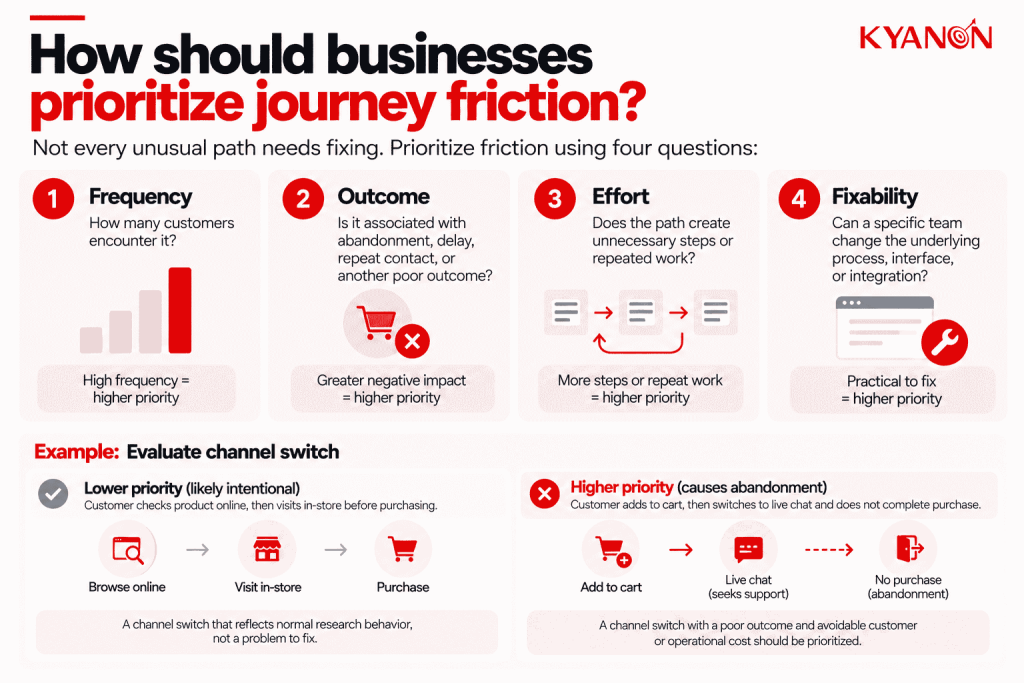
Not every unusual path needs fixing. Prioritize friction using four questions:
- Frequency: How many customers encounter it?
- Outcome: Is it associated with abandonment, delay, repeat contact, or another poor outcome?
- Effort: Does the path create unnecessary steps or repeated work?
- Fixability: Can a specific team change the underlying process, interface, or integration?
A frequent channel switch, for example, may be intentional rather than problematic. Prioritize the path when evidence shows that the transition creates avoidable customer or operational cost.
Journey analytics vs. funnel analytics
Funnel analytics measures progression through predefined stages; journey analytics investigates the different paths customers actually take between interactions and channels.
| Journey Analytics | Funnel Analytics | |
Structure | Multiple possible paths | Predefined stages |
| Best for | Cross-channel journeys, loops and repeat interactions | Conversion through a defined process |
Reveals | Channel switches, delays, repeats and path variation | Stage conversion and drop-off |
| Key question | What paths lead to different outcomes? | Where do customers leave the funnel? |
Use funnel analytics when the expected path is clear. Use journey analytics when customers can reach the same outcome through multiple channels, sequences, or repeated attempts.
Journey analytics vs. customer journey map
Journey analytics examines observed interaction data; a customer journey map organizes a researched understanding of stages, needs, and experiences.
Dimension | Journey Analytics | Customer Journey Map |
Primary form | Analytical datasets and path reports | Visual research artifact |
| Evidence | Events, transactions, service records | Research, observations, and feedback |
Strength | Scale, timing, frequency, variation | Meaning, needs, and experience context |
| Limitation | Only captures observable connected activity | May simplify variation or become outdated |
Best use | Validate patterns and measure change | Build shared understanding and hypotheses |
When to consider journey analytics
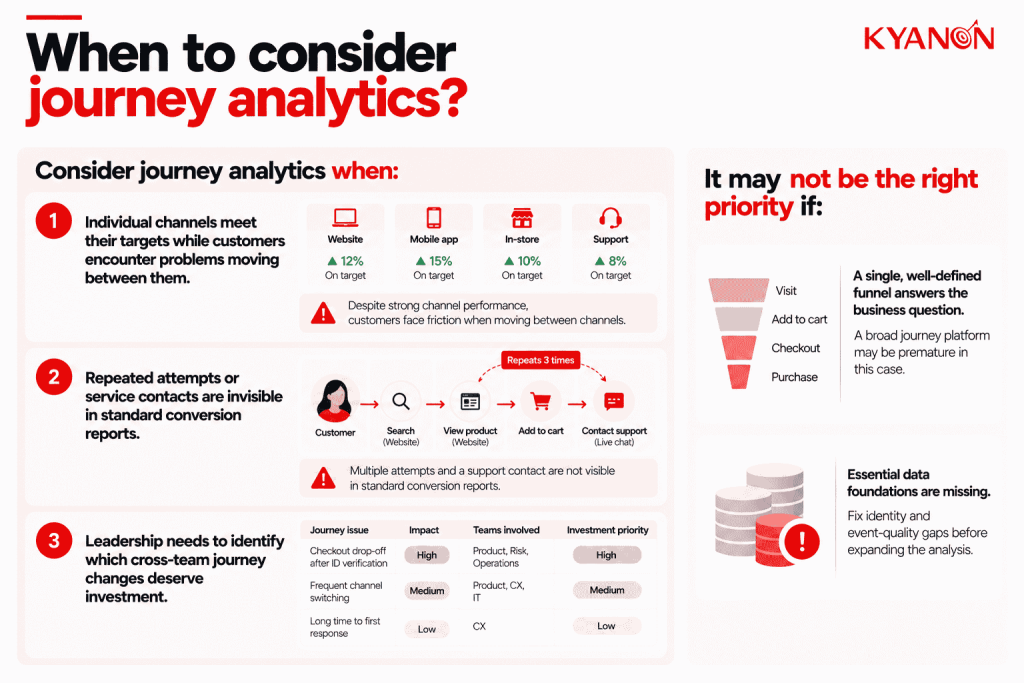
Consider journey analytics when the following conditions affect customer outcomes or operational control:
- Individual channels meet their targets while customers encounter problems moving between them
- Repeated attempts or service contacts are invisible in standard conversion reports
- Leadership needs to identify which cross-team journey changes deserve investment
It may not be the right priority if:
A broad journey platform may be premature when a single well-defined funnel answers the business question. Fix essential identity and event-quality gaps before expanding the analysis.
Why journey analytics matters for retail and financial services
Individual channel metrics can appear healthy while customers still struggle with the end-to-end journey. Journey analytics exposes problems that occur between teams, systems, and touchpoints rather than within a single dashboard.
In retail, this can reveal friction between browsing, purchasing, fulfillment, returns, and customer service. In financial services, it can connect application submission, verification, document requests, repeat uploads, and support interactions to distinguish successful from stalled journeys.
The business value is not simply discovering the most common path. It is identifying which journey patterns are associated with poor outcomes and which underlying process, experience, or integration should change.
Case study: How did Kyanon Digital improve visibility into the customer journey?

For a booking and resident-experience platform, Kyanon Digital connected customer-facing journeys with centralized operational capabilities and analytics.
- Challenges: Fragmented experiences and systems limited visibility across customer booking and service journeys.
- Solutions: Kyanon Digital developed an integrated platform with visibility into the booking journey and centralized insights across occupancy, services, and resident engagement.
- Results & impacts: The platform created a foundation for continuously identifying booking friction, improving conversion, and optimizing the wider customer lifecycle.
The case demonstrates why journey analytics needs more than a dashboard: customer interactions must be connected to the operational context and outcomes that explain whether the journey is working.
Common misconceptions
“A journey dashboard captures the entire customer experience.”
Reality: Some actions occur outside observed systems, and some identities cannot be reliably linked. Make those gaps visible instead of presenting the reconstruction as complete.
“The most common path is the best path.”
Reality: A common path may include repeated work or unnecessary contact. Assess outcomes and effort before treating frequency as a design target.
“Journey analytics tells us why customers behave that way.”
Reality: Journey analytics reveals patterns and associations in observed behavior, but a path alone does not prove customer motivation or causation. Use customer research, operational evidence, or experiments to test why a journey pattern occurs.
How Kyanon Digital applies journey analytics
Kyanon Digital connects behavioral, transactional, service, and operational data to help organizations understand customer journeys across systems and touchpoints. This can include data integration, journey definitions, path analysis, and outcome measurement.
Explore Kyanon Digital’s Data, Analytics & Business Intelligence Service

 Create project brief with AI