
What is journey mapping (commerce)?
Journey mapping (commerce) is an analytical framework that visualizes the complete sequence of customer interactions, emotions, and friction points across chronological phases from initial discovery to post-purchase advocacy. It functions as a strategic baseline for identifying conversion bottlenecks across digital and physical touchpoints.
How journey mapping (commerce) works
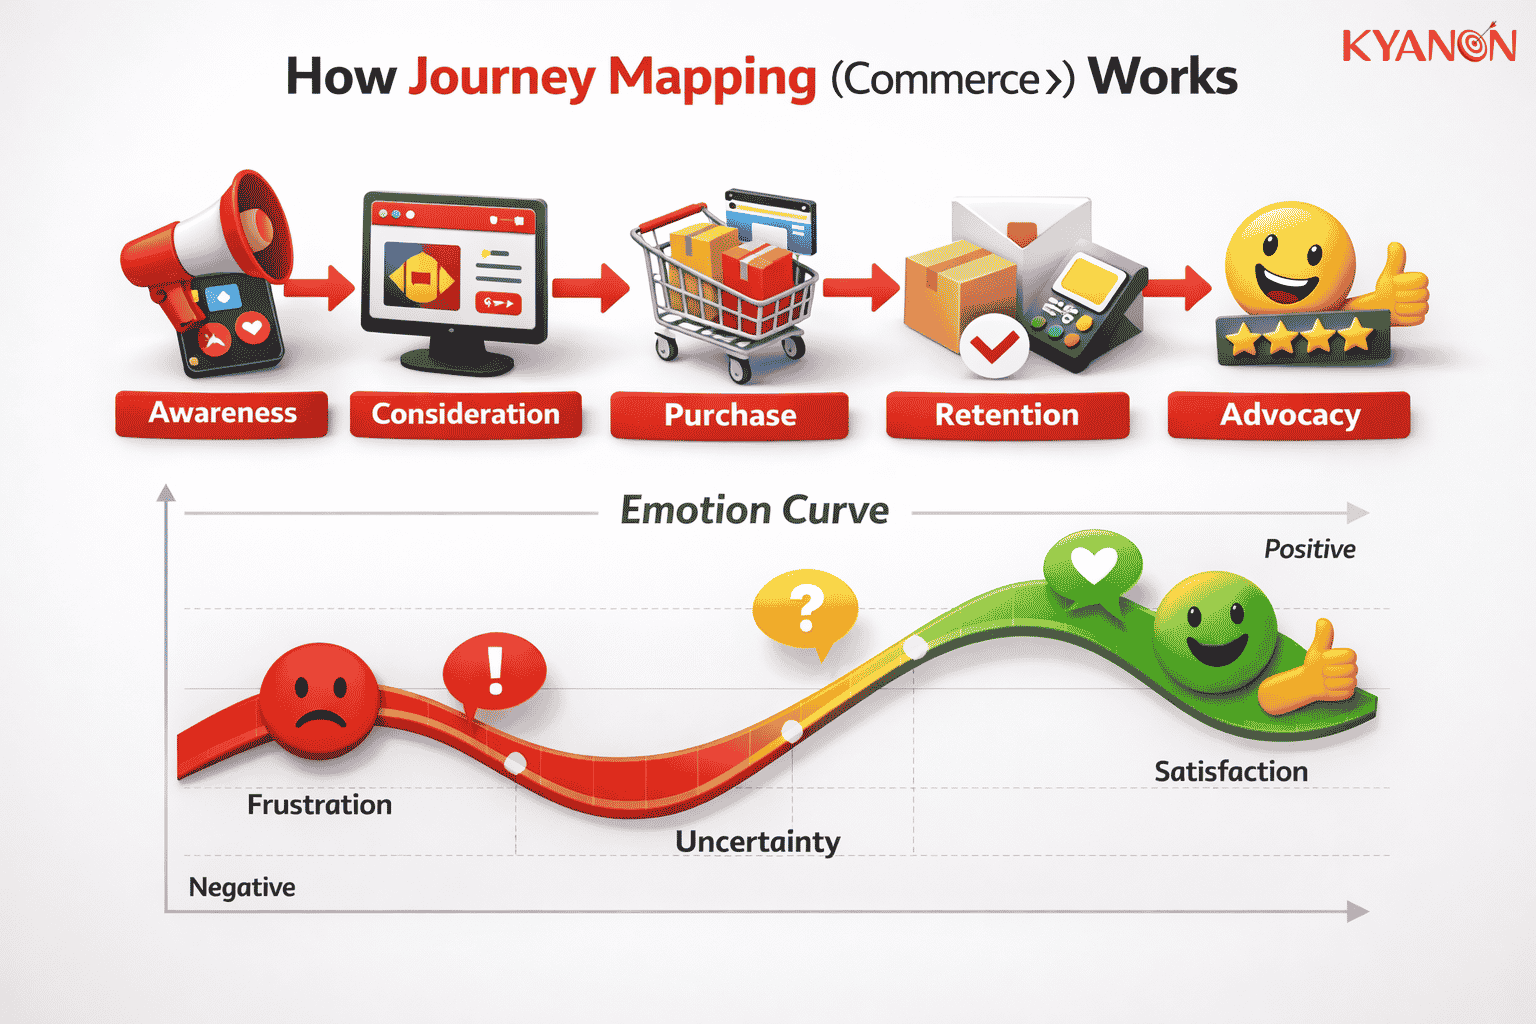
Journey mapping operates by deconstructing the buying lifecycle into specific chronological phases to isolate both behavioral data and emotional friction. Instead of documenting backend system triggers, it visualizes what users do, think, and feel at every touchpoint, enabling organizations to eliminate purchasing hurdles systematically.
Chronological phase definition
The process segments customer interactions into five standard stages: awareness, consideration, purchase, retention, and advocacy. This chronological structuring ensures that drop-off analysis accounts for the entire lifecycle rather than just the final checkout step.
Touchpoint and emotion tracking
Every brand interaction, from social media advertisements to transactional shipping emails, is cataloged alongside the user’s cognitive and emotional state. Highlighting negative emotions like confusion during navigation or frustration during form input helps prioritize specific UX interventions.
Friction analysis and team alignment
Identified barriers are analyzed using quantitative drop-off data to locate broken links or unnecessary checkout steps. The resulting visualization aligns cross-functional teams (marketing, sales, and IT support) around actual user behavior rather than internal departmental assumptions.

Journey mapping (commerce) vs. internal process mapping
Both practices document workflows and operational sequences, but they differ fundamentally in perspective, data inputs, and optimization goals.
Dimension | Journey mapping (commerce) | Internal process mapping |
Perspective | Customer-centric (Outside-in) | Operational (Inside-out) |
| Primary metric | Conversion rate, LTV, NPS | Efficiency, SLA compliance, Cost |
Output focus | User actions, emotions, friction | System triggers, handoffs, ERP updates |
| Data sources | Analytics, heatmaps, interviews | System logs, department SOPs |
Target outcome | Reduced purchasing hurdles | Streamlined backend workflows |
When to consider journey mapping (commerce)
Consider journey mapping (commerce) if:
- Your analytics show high traffic volumes but significant drop-offs at specific funnel stages, such as the transition from product detail pages (PDP) to checkout.
- You observe high customer acquisition costs paired with poor post-purchase retention, indicating a disconnect between pre-sale marketing and post-sale support.
- Different internal departments operate in silos, causing fragmented user experiences when customers transition from marketing channels to technical support.
It may not be the right priority if:
- Your product is in an early-stage MVP phase with a single sales channel and insufficient traffic data to establish statistically significant behavioral or emotional patterns.
Why journey mapping (commerce) matters for enterprise retail
Mapping the commerce lifecycle directly correlates with a reduction in lost revenue and an increase in lifetime value (LTV) by aligning technical teams around verified user behavior.
According to the Baymard Institute (2026), the global average online shopping cart abandonment rate sits at 70.22%, a direct indicator of checkout friction that journey mapping specifically isolates. A regional omnichannel retailer utilized behavioral journey mapping to identify post-purchase anxiety among new buyers, reducing customer support ticket volume by 30% after implementing proactive SMS delivery tracking. This demonstrates how visualizing customer emotions translates directly into operational cost savings and improved retention.
Common misconceptions
“The customer journey is a neat, linear timeline.”
Reality: Modern commerce is chaotic, looping, and unpredictable. Customers might view an ad on Instagram, read reviews on Reddit, visit a physical store to try the product, and finally purchase via a mobile app using a discount code; mapping a straight line ignores real-world shopping behavior.
“Internal workflows, ERP updates, or marketing automation triggers count as a customer journey.”
Reality: Internal workflows represent your organizational process. True journey maps must represent the customer’s perspective, including their actions, feelings, and the friction points they encounter.
“A workshop room full of internal stakeholders guessing how customers feel is sufficient.”
Reality: Valid maps require a mix of user interviews (qualitative) and hard analytics data (quantitative). Without combining workshop sticky notes with actual Google Analytics data, heatmaps, and customer support tickets, engineering teams risk fixing problems that do not actually exist.
“Once the map is designed, printed, and hung on the wall, the job is done.”
Reality: Consumer behaviors, technology, and market channels are constantly changing. Treat a journey map like software that requires regular updates, behavioral data refreshes, and continuous optimization.
How Kyanon Digital applies journey mapping (commerce)
Kyanon Digital integrates commerce journey mapping within our UX and CRO engagements to prioritize architectural improvements that directly impact revenue. Utilizing a combination of quantitative analytics and user behavioral tracking, we plot chronological phases and emotional touchpoints for enterprise clients across Vietnam, Singapore, ANZ, and Nordic Europe. Our methodology aligns technical and business teams to isolate exact conversion blockers, ensuring that development efforts focus strictly on measurable outcomes like reduced time-to-market, higher conversion rates, and lower total cost of ownership (TCO).
→ Explore our: Omnichannel eCommerce Solutions Service

 Create project brief with AI