
What is a KPI dashboard (commerce)?
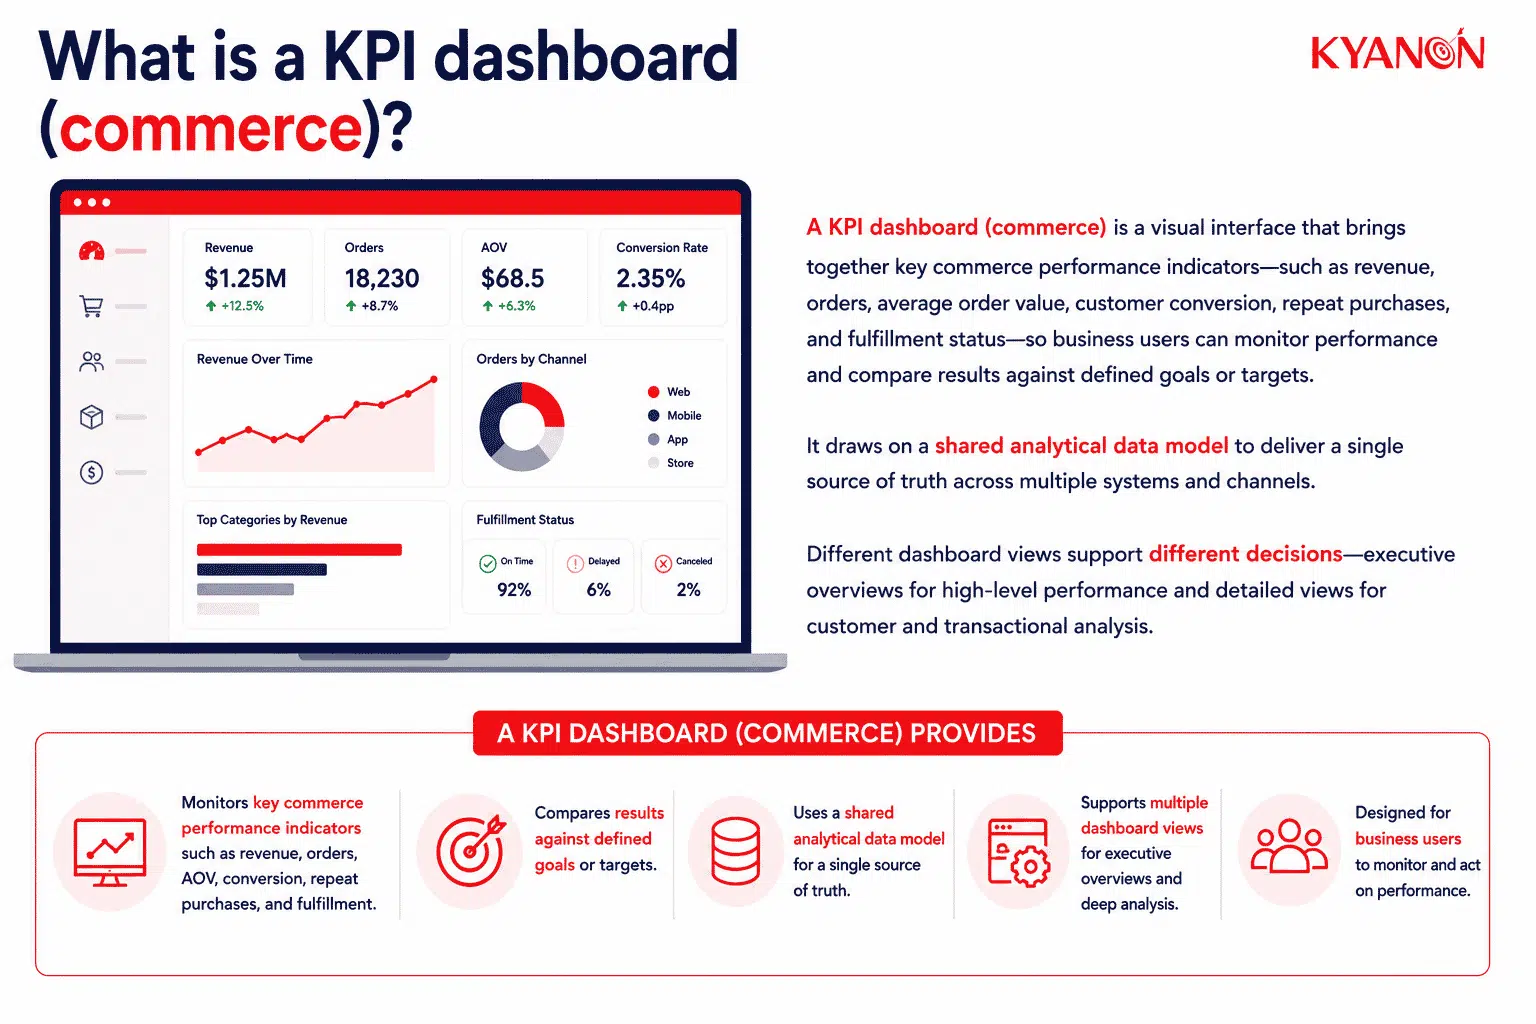
A KPI dashboard (commerce) is a visual interface that brings together the most important commerce performance indicators, such as revenue, orders, average order value, customer conversion, repeat purchases, and fulfillment status, so business users can monitor performance and compare results against defined goals or targets. Microsoft defines dashboards as single-page views containing the most important visualizations, while KPI visuals are specifically used to evaluate a metric’s current value and status against a measurable target.
In a commerce context, the dashboard typically draws on a shared analytical data model rather than displaying isolated statistics. Adobe Commerce Intelligence, for example, consolidates data from multiple sources into a single source of truth and provides dashboards covering revenue, orders, average order value, customer retention, conversion, repeat purchases, and order status. Different dashboard views can also be designed for different decision needs; Adobe’s executive dashboard provides a high-level business overview, while other dashboards provide deeper customer and transactional analysis.
How a KPI dashboard (commerce) works
A commerce KPI dashboard works by converting transaction and operational data into governed KPI calculations, then presenting those calculations at the refresh frequency and decision level required by each business role.
The value of the dashboard comes from the relationship between the metrics. A decline in revenue may be evaluated alongside traffic, conversion, average order value, stock availability, promotion performance, payment failures, return rates, and fulfillment delays rather than treated as an isolated result.
Governed KPI model
A governed KPI model defines each metric, its formula, source systems, ownership, reporting period, inclusion rules, and permitted dimensions. This prevents departments from calculating revenue, conversion, active customers, available inventory, or returns differently.
For example, gross merchandise value, booked revenue, recognized revenue, and net sales are related measures but are not interchangeable. The dashboard must state which measure is being used and how cancellations, returns, taxes, shipping fees, discounts, and marketplace commissions are treated.
Unified commerce data layer
The data layer consolidates information from systems such as the commerce platform, point-of-sale system, order management system, ERP, CRM, warehouse platform, payment gateway, loyalty platform, and digital analytics tools.
The dashboard is only as reliable as the data and calculation layer beneath it. Data quality controls, reconciliation rules, refresh monitoring, master-data standards, and clear source ownership are therefore part of the dashboard capability rather than separate reporting concerns.
Core commerce KPI categories
A commerce KPI dashboard should combine financial outcomes with the customer, marketing, inventory, and fulfillment drivers that influence those outcomes.
Common KPI categories include:
- Sales and revenue: Net sales, gross merchandise value, revenue growth, average order value, gross margin, and contribution margin.
- Customer journey: Website traffic, product-view-to-cart rate, cart abandonment, checkout conversion, repeat purchase rate, and store conversion.
- Inventory and fulfillment: Stock-out rate, inventory turnover, order cycle time, on-time fulfillment, cancellation rate, and product return rate.
- Marketing efficiency: Customer acquisition cost, return on ad spend, campaign conversion, revenue attribution, and promotional profitability.
These categories should not automatically appear on every dashboard. Each view should prioritize the metrics connected to the decisions, responsibilities, and commercial targets of its intended users.
Role-based views and exception management
A role-based dashboard presents the same governed data at different levels of detail. Executives may monitor revenue, margin, customer growth, inventory exposure, and forecast variance, while eCommerce managers investigate channel conversion, campaign contribution, search performance, payment failures, and checkout abandonment.
Operational views can highlight exceptions requiring intervention, such as stockouts, delayed orders, failed payments, unusual return rates, low promotion profitability, or missed fulfillment service levels. Drill-downs and filters then allow users to move from an enterprise indicator to the affected channel, market, store, category, product, campaign, or order segment.
Common commerce dashboard approaches
Commerce organizations generally use one of three dashboard approaches, depending on their data complexity, reporting scope, and governance requirements.
| Dashboard approach | Typical use | Main advantage |
Key limitation |
|
Native commerce analytics |
Built-in reporting within platforms such as Shopify or Adobe Commerce | Faster setup for standard sales, product, traffic, and order reporting | Limited visibility across external marketing, finance, inventory, and customer systems |
| Dedicated dashboard platforms | Multi-source dashboards created through platforms such as Geckoboard, Klipfolio, or Domo | Consolidates recurring metrics from several commerce and marketing applications |
May require additional governance and data preparation as reporting complexity increases |
|
Enterprise business intelligence |
Customized dashboards developed through Microsoft Power BI, Tableau, or similar BI platforms | Supports governed data models, granular segmentation, role-based access, and enterprise-wide reporting |
Requires stronger data engineering, ownership, maintenance, and implementation resources |
Native analytics may be sufficient for a single commerce platform with straightforward reporting needs. Enterprise BI becomes more relevant when performance must be reconciled across several brands, countries, stores, marketplaces, advertising platforms, warehouses, and financial systems.
KPI dashboard (commerce) vs commerce analytics report
A commerce KPI dashboard supports continuous performance monitoring, while a commerce analytics report usually provides a structured analysis of a defined question, period, or business event.
| Dimension | KPI Dashboard (Commerce) |
Commerce Analytics Report |
|
Primary purpose |
Monitor agreed-upon KPIs and identify exceptions | Explain performance or answer a defined analytical question |
| Update cadence | Scheduled, near-real-time, daily, or weekly refresh |
Produced for a specific reporting period or analysis cycle |
|
User interaction |
Filters, drill-downs, comparisons, alerts, and segmentation | Usually consumed as a fixed or semi-interactive document |
| Metric scope | Limited to recurring decision-critical KPIs |
Can include broader exploratory metrics and supporting analysis |
|
Decision horizon |
Ongoing operational and management decisions | Periodic reviews, investigations, planning, and recommendations |
| Primary audience | Executives, commerce leaders, merchandising, inventory, marketing, and operations teams |
Stakeholders reviewing a specific issue, campaign, period, or strategic question |
|
Exception detection |
Designed to surface target variance, anomalies, and operational thresholds | May explain exceptions after they have already been identified |
| Output | Persistent performance-management interface |
Presentation, spreadsheet, written report, or analysis workspace |
|
Governance requirement |
Requires stable definitions used repeatedly across teams | Definitions may be adapted to the scope of the individual analysis |
| Best suited for | Recurring performance control and accountability |
Root-cause analysis, evaluation, forecasting, and business recommendations |
A dashboard and an analytics report are complementary rather than competing deliverables. The dashboard identifies where performance requires attention; deeper analysis determines why the variance occurred and what response is appropriate.
When to consider a KPI dashboard (commerce)
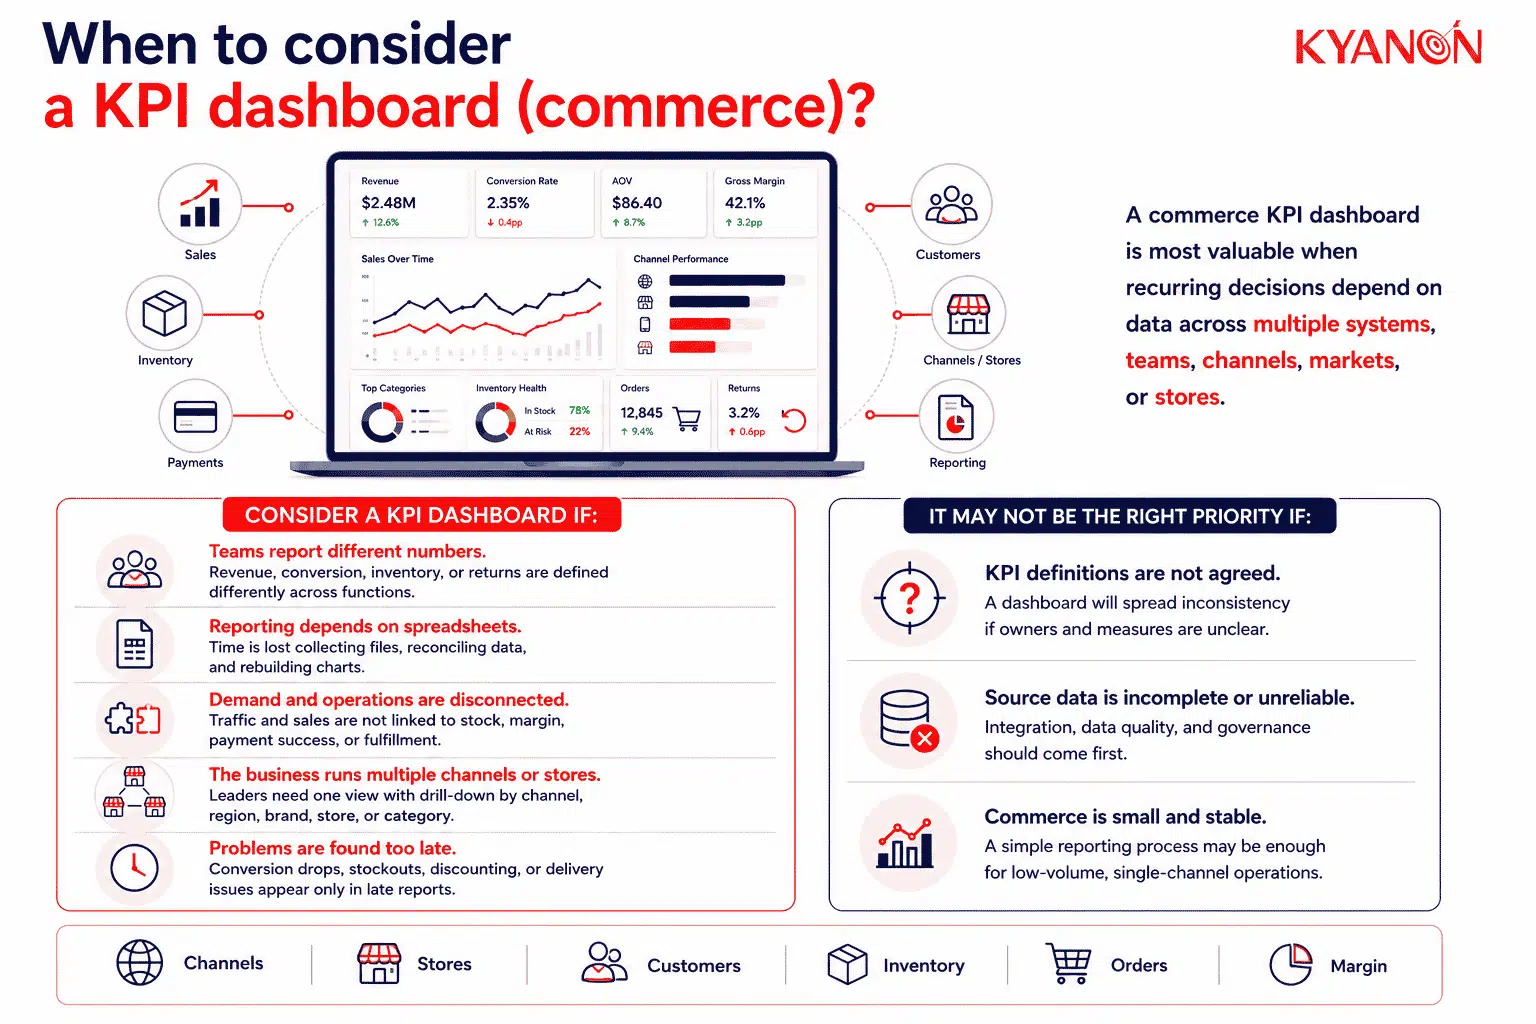
A commerce KPI dashboard should be considered when recurring commercial decisions depend on data from multiple systems, teams, channels, markets, or stores.
Consider a KPI dashboard (commerce) if:
- Leadership receives conflicting performance figures. Finance, commerce, marketing, merchandising, and operations teams may be using different definitions for revenue, conversion, active customers, returns, or available inventory.
- Commerce performance is reviewed through manual spreadsheets. Significant time may be spent collecting files, reconciling values, rebuilding charts, and explaining discrepancies before decision-making can begin.
- The business cannot connect customer demand with operational execution. Traffic and sales data may be visible, but decision-makers cannot relate them to stock availability, margin, payment success, order delays, returns, cancellations, or customer retention.
- The organization operates multiple channels, brands, markets, or stores. Decision-makers need a consistent enterprise view while retaining the ability to compare performance by channel, region, location, category, customer segment, and product.
- Teams identify commercial problems too late. Conversion decline, stockouts, excessive discounting, margin erosion, payment failures, or missed fulfillment targets may only become visible during month-end reporting.
It may not be the right priority if:
- The organization has not agreed on KPI definitions or ownership. Visualizing disputed measures will distribute inconsistency rather than resolve it.
- Source data is incomplete or cannot be reconciled. Data integration, quality management, and master-data governance should be addressed before the dashboard is treated as a management system.
- The business has a small and stable commerce operation. A limited product range, single channel, low transaction volume, and straightforward reporting requirements may be managed effectively with a simpler reporting process.
Why a KPI dashboard (commerce) matters for retail and e-commerce
A commerce KPI dashboard reduces the time spent collecting and reconciling data by presenting governed metrics from commerce, marketing, inventory, customer, and fulfillment systems in one recurring management view.
Its business value comes from shortening the gap between a performance change and the decision required to address it. Current or frequently refreshed data allows teams to identify conversion decline, stock shortages, campaign inefficiency, payment failures, return increases, or fulfillment delays before these issues are hidden inside month-end reporting.
A commerce KPI dashboard also connects customer behavior, revenue, margin, inventory, and order execution in one decision context rather than reviewing each function in isolation.
This connection allows decision-makers to distinguish between symptoms and underlying commercial conditions. Falling revenue may result from lower traffic, weaker conversion, unavailable products, reduced promotion effectiveness, payment failures, increased cancellations, or slower fulfillment; each cause requires a different response.
Baymard Institute reported in 2025 that the average online shopping cart abandonment rate was 70.19%. This does not mean a dashboard can recover abandoned carts by itself; it shows why commerce leaders need consistent visibility into funnel progression, checkout completion, payment failures, device performance, delivery costs, and other sources of conversion leakage.
Baymard also estimated that large eCommerce sites could achieve an average 35.26% conversion-rate increase by addressing documented checkout usability issues. A KPI dashboard provides the measurement layer needed to establish a baseline, prioritize affected segments, and determine whether implemented changes produce sustained improvement.
How Kyanon Digital centralized retail performance reporting across 193+ stores

Challenges
- Manual, error-prone reporting slowed decision-making.
- Store data was fragmented across different sources.
- Leadership lacked timely visibility into operational and store performance.
Solutions
- Built a centralized data warehouse for storing reporting data.
- Standardized report submission and approval workflows.
- Integrated Microsoft Power BI for dynamic performance dashboards.
- Enabled filtering by store, region, time period, and product category.
Results & impact
- Reduced manual reporting and data-reconciliation effort.
- Improved consistency of reporting across stores.
- Gave leadership real-time visibility into KPIs and store performance.
- Enabled faster identification of trends and operational exceptions.
Read more: AI-Driven BI & Data Warehouse For A Leading Retail Corporation
Common misconceptions
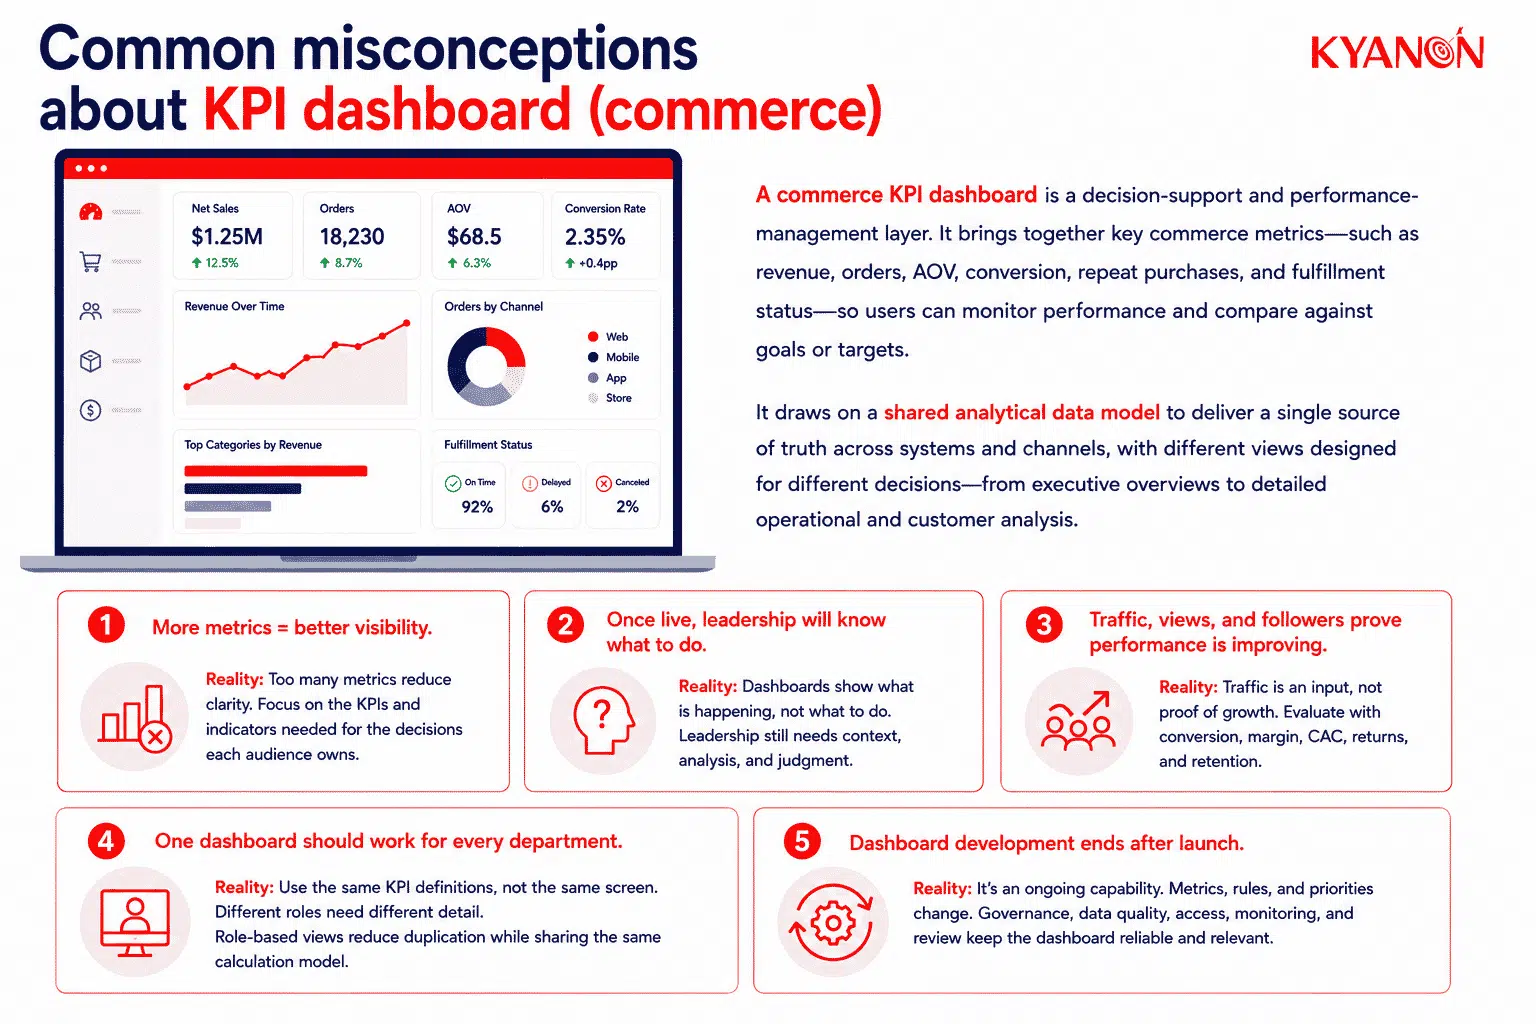
A commerce KPI dashboard is a decision-support and performance-management layer; it does not replace business judgment, correct unreliable data, or create growth simply by displaying more metrics.
“The more metrics we put on the dashboard, the better the visibility.”
Reality: More metrics can reduce decision clarity when users cannot distinguish outcomes, drivers, diagnostics, and contextual measures. Each dashboard should be limited to the KPIs and supporting indicators required for the decisions its audience owns.
An executive view may prioritize net sales, gross margin, customer growth, inventory exposure, and forecast variance. A daily commerce-operations view may require order backlog, payment failures, stockouts, cancellation reasons, and fulfillment service levels.
“Once the dashboard is live, leadership will know what decision to make.”
Reality: A dashboard shows performance, variance, and relationships in the data; it does not determine the commercial response. Leaders still need business context, causal analysis, customer research, operational judgment, and clear decision rights.
A falling conversion rate may justify a checkout investigation, but it does not automatically prove that the checkout experience is the cause. Traffic quality, product availability, pricing, promotion rules, device mix, payment performance, and delivery conditions must also be evaluated.
“Traffic, views, and followers prove that commerce performance is improving.”
Reality: Traffic and engagement are inputs, not evidence of profitable commerce growth. They should be evaluated alongside conversion, net revenue, contribution margin, customer acquisition cost, repeat purchase, returns, cancellations, and fulfillment cost.
A campaign that increases sessions but produces low-margin orders, high returns, or no repeat purchases may create activity without creating sustainable commercial value.
“One dashboard should work for every department.”
Reality: Every function should use the same governed KPI definitions, but not the same screen. Executives, eCommerce managers, finance teams, merchandisers, marketers, inventory planners, and fulfillment leaders operate at different decision levels and require different detail.
Role-based views reduce reporting duplication while preserving a shared version of performance. The executive revenue figure and the category manager’s product-level breakdown should originate from the same calculation model.
“Dashboard development ends after launch.”
Reality: A commerce KPI dashboard is an operating capability, not a static design deliverable. Metrics, targets, business rules, data sources, channel structures, customer segments, and management priorities change as the commerce model evolves.
Dashboard governance should therefore include KPI ownership, change control, data-quality monitoring, user-access reviews, refresh-service monitoring, adoption measurement, and periodic removal of indicators that no longer support decisions.
How Kyanon Digital applies KPI dashboards in commerce
Kyanon Digital develops commerce KPI dashboards as part of broader data engineering, analytics, and business intelligence engagements rather than treating visualization as an isolated reporting task.
The work typically begins by aligning business owners on decision requirements, KPI definitions, calculation rules, reporting dimensions, refresh expectations, and ownership. Data is then integrated from relevant commerce systems, which may include e-commerce platforms, POS, ERP, OMS, CRM, WMS, payment, loyalty, marketing, marketplace, and customer service platforms.
Kyanon Digital’s dashboard scope can include:
- Commerce KPI discovery and business-definition workshops
- Source-system and data-quality assessment
- Data pipelines and centralized analytical repositories
- Governed data models and reusable KPI calculation layers
- Executive, commercial, merchandising, marketing, inventory, and fulfillment dashboards
- Role-based access and market- or business-unit-level permissions
- Data reconciliation and dashboard validation
- Alerting, exception thresholds, refresh monitoring, and operational support
- Documentation, user training, and dashboard-governance processes
Kyanon Digital has implemented centralized data architectures, automated reporting, real-time and predictive analytics, and customized BI dashboards for enterprise clients. Its Insights & Analytics practice combines data engineering, cloud infrastructure, business intelligence, AI, and MarTech capabilities to support this delivery model.
The intended outcome is a governed performance-management environment that reduces reporting effort, shortens the time between identifying and acting on commercial variance, and provides a consistent basis for monitoring conversion, inventory, fulfillment, customer, and cost performance.
→ Explore Kyanon Digital’s Insights & Analytics services.











 Create project brief with AI