
What is Jensen’s Inequality (ML)?
Jensen’s Inequality (ML) is a mathematical principle showing that applying a nonlinear function before taking an expectation usually produces a different result than applying the function after taking the expectation. In machine learning, it explains why transformed predictions, probabilistic forecasts, and variational inference objectives can produce biased business estimates if uncertainty is not handled correctly.
How Jensen’s Inequality (ML) Works
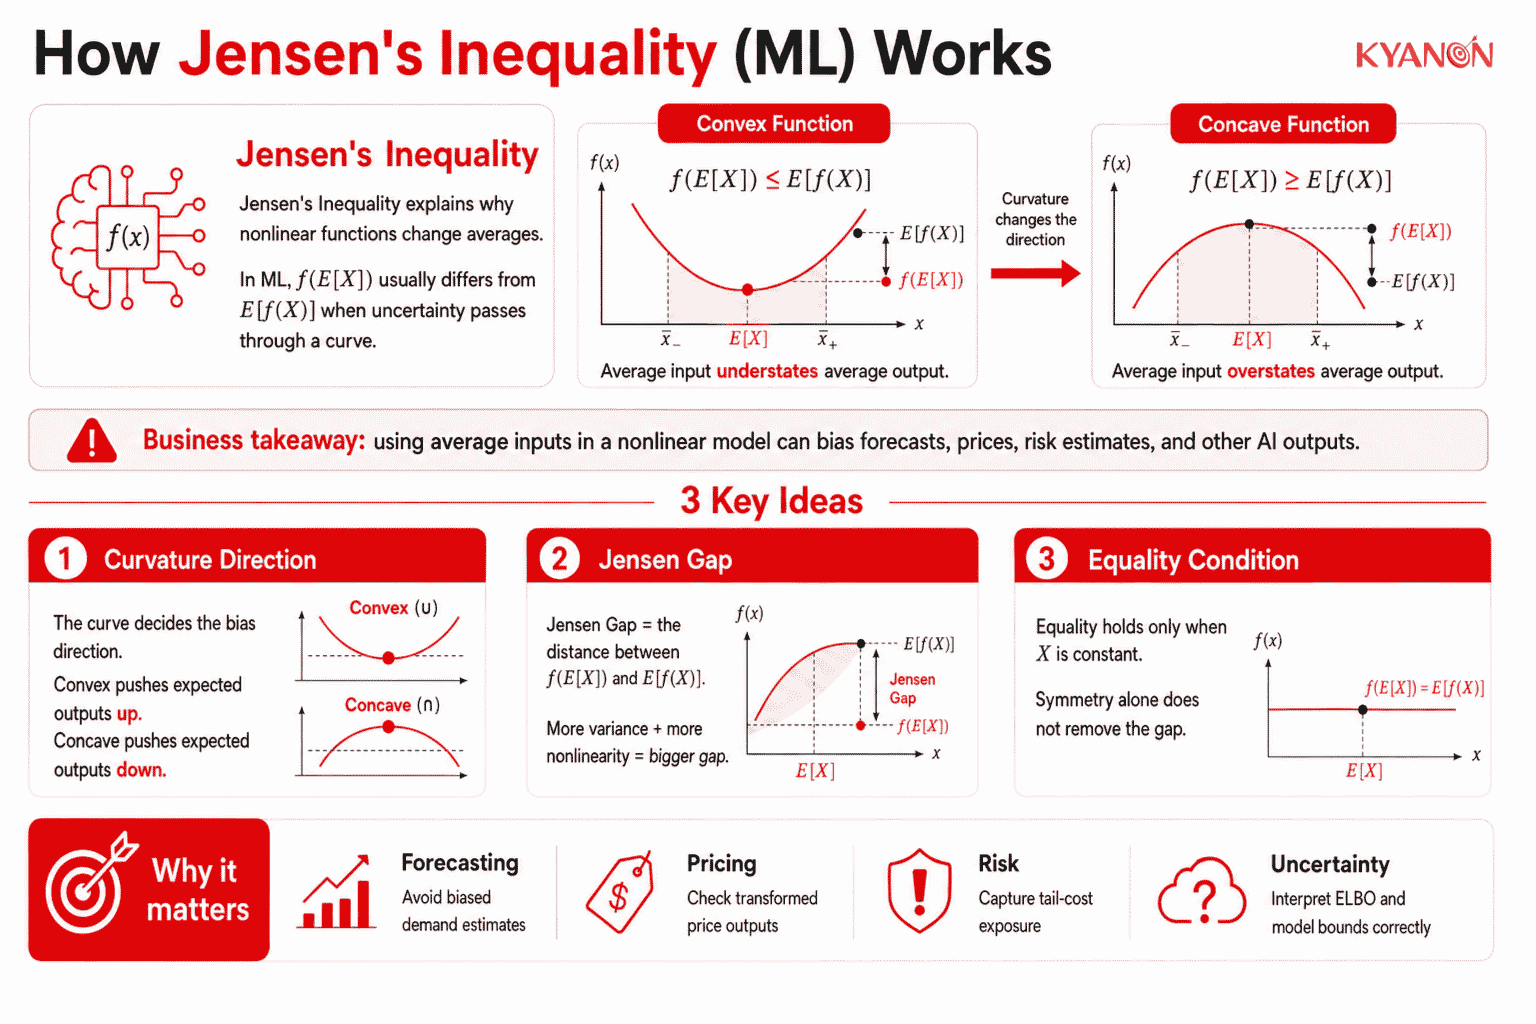
Jensen’s Inequality works because nonlinear functions change the average value of uncertain inputs depending on their curvature. In ML systems, this matters when models transform probabilities, prices, risks, losses, or latent variables because the average prediction after a nonlinear transformation may not equal the transformed average prediction.
Curvature Direction
Curvature determines whether the inequality points upward or downward. Convex functions such as squared loss create (f(\mathbb{E}[X]) \le \mathbb{E}[f(X)]), while concave functions such as log functions create (f(\mathbb{E}[X]) \ge \mathbb{E}[f(X)]). For AI leaders, this means the business impact depends on the transformation being applied, not only on the model’s average prediction.
Jensen Gap
The Jensen Gap is the distance between (f(\mathbb{E}[X])) and (\mathbb{E}[f(X)]). In machine learning, the Jensen Gap can affect log-likelihood estimation, probabilistic forecasting, transformed target prediction, and uncertainty-aware model evaluation. A larger input variance or stronger nonlinearity usually increases the risk that the gap becomes material.
Equality Condition
For a strictly convex or strictly concave function, equality holds only when the random variable is effectively constant. Symmetric or centered data does not remove the Jensen Gap if the data still has variance. This is important for enterprise forecasting because stable-looking averages can still hide meaningful uncertainty.

How the Jensen Gap Distorts AI Forecasts
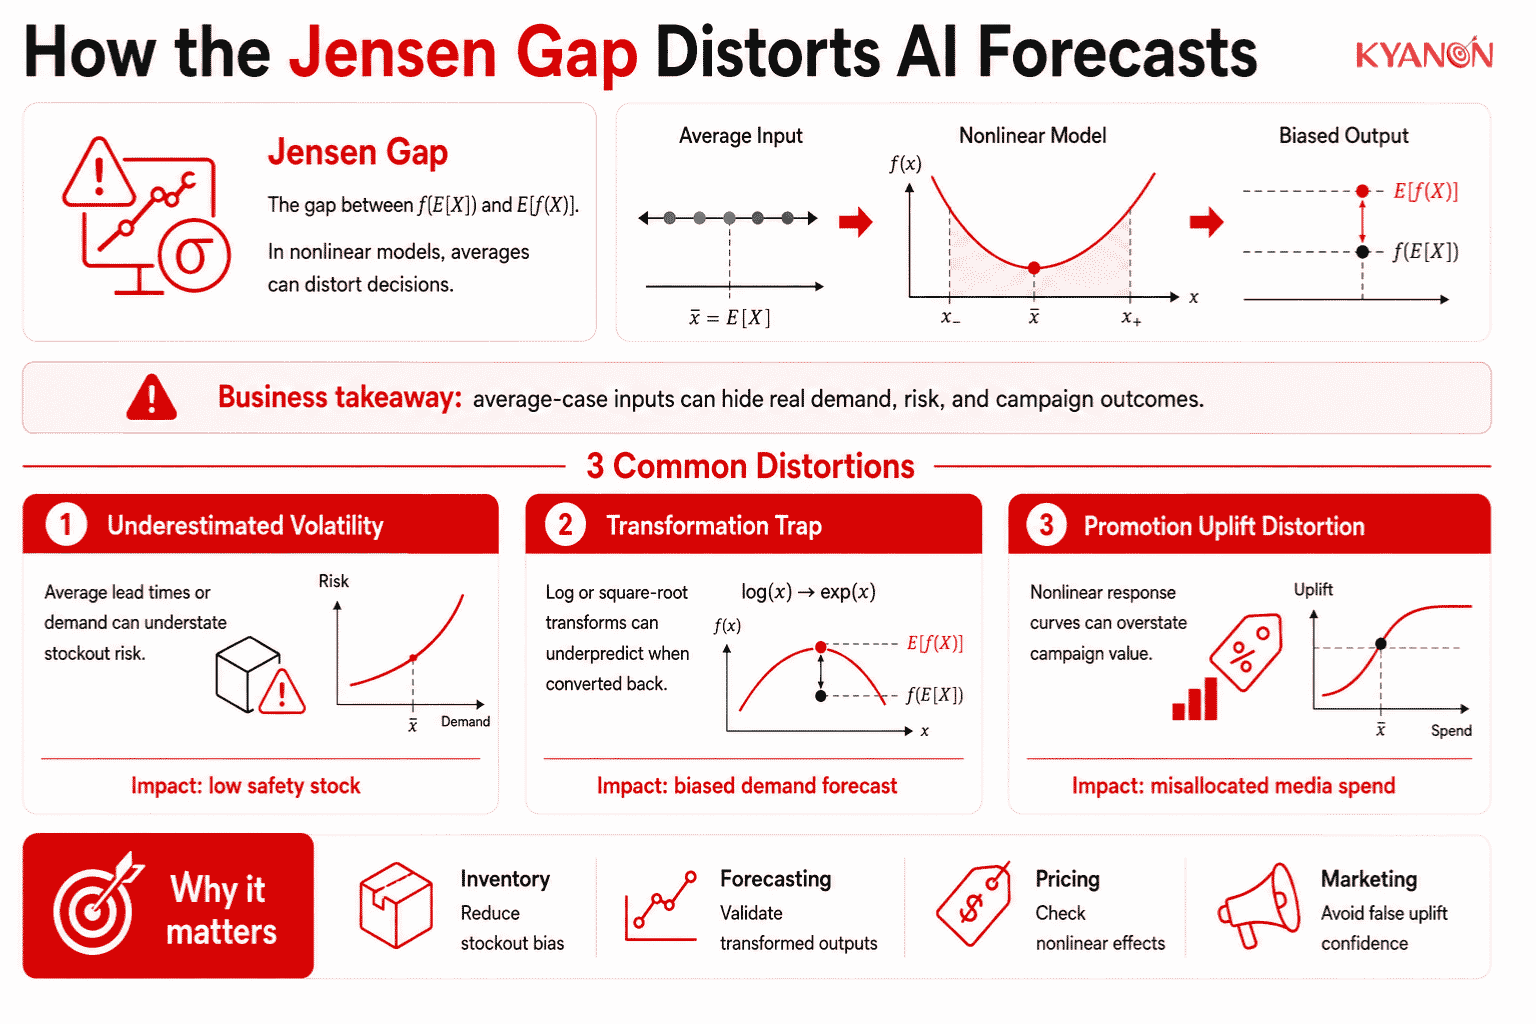
Predictive AI pipelines that feed average-case inputs directly into non-linear mathematical functions systematically miscalculate enterprise operational risk.
- Underestimating volatility (convex risk): When predicting system stock-outs, extreme weather events, or market crashes, the cost function is convex, meaning tail events carry exponential penalties. A forecast based on average demand or supply chain delays will mathematically underestimate the expected risk of failure.
- Data transformation traps: Machine learning engineers often transform skewed data (e.g., using logarithms or square roots) to stabilize variance before model training. When the model’s output is later reverted to the original scale, taking the mean of this transformation incorrectly estimates the true average due to the inherent non-linearity.
- Promotion uplift distortion: When uplift models estimate average campaign impact across customer segments, nonlinear response curves can make the campaign look more profitable or less risky than it really is. This can lead teams to over-discount, over-target low-margin customers, or misallocate media spend.
Top AI Forecasting Risks & Manifestations
AI forecasting risks manifest when models fail to account for the convex penalties of tail-end distributions, causing systemic miscalculations in supply chain and financial operations.
- Underestimating safety stock & lead times: In supply chain AI, if an algorithm plans operations based on average lead times (e.g., 5 days) rather than factoring in the full distribution of delays, the model will critically under-forecast required inventory. The cost of stockouts is convex, meaning the financial penalties of severe tail delays disproportionately exceed what the average predicts.
- Log-scale transformations (the M5 trap): Machine learning models frequently utilize variance-stabilizing log or square-root transformations on volatile, right-skewed data (such as sales or financial counts) to normalize them during training. When the AI’s predictions are reverted to the original scale by exponentiating them, Jensen’s inequality guarantees that the model will systematically under-predict future demand.
- Model ensembles & averaging probabilities: In classification or probability forecasting, taking the direct mathematical average of probabilities from an ensemble of models introduces structural error. Because calibration curves (the mapping from predicted score to true event rate) are non-linear, simply averaging the probabilities misrepresents the true confidence of the ensemble.
How to Mitigate Jensen-Related Forecasting Risks
Mitigating Jensen-related forecasting risks requires organizations to correct non-linear transformation biases mathematically and simulate full data distributions rather than relying on average inputs.
- Simulate, don’t substitute: Avoid feeding average inputs into a non-linear model. Utilize Monte Carlo simulations to pass the entire distribution of possible variables through the model and calculate the mathematical average of the resulting outputs.
- Reversal corrections: When transforming predictions (e.g., exponentiating log forecasts), apply a structural bias-correction term, such as adding half the variance, to mathematically offset the Jensen Gap during the inverse transformation.
- Calibrate for risk profiles: Adjust loss functions to penalize the mathematical direction of the Jensen Gap. Deploy asymmetric loss functions, such as Lin-Lin or Linex, to align the model with specific financial risk parameters.
Jensen-Aware Modeling vs Naive Deterministic Modeling
Both approaches handle target variable transformations, but they differ fundamentally in structural bias treatment and accuracy for uncertain environments.
Dimension | Jensen-Aware Probabilistic Modeling | Naive Deterministic Modeling |
| Forecast input | Uses full distribution of uncertainty | Uses average inputs or point estimates |
Bias handling | Corrects nonlinear transformation bias | May ignore bias after inverse transforms |
| Best for | Demand, pricing, inventory, CLV, risk forecasting | Low-variance, simple operational reporting |
Business risk | Lower risk of stockout and margin misreads | Higher risk when volatility is high |
| Governance need | Requires calibration and scenario validation | Easier to operate but weaker under uncertainty |
Output type | Range of possible outcomes with confidence | Single expected value |
When to Consider Jensen’s Inequality (ML)
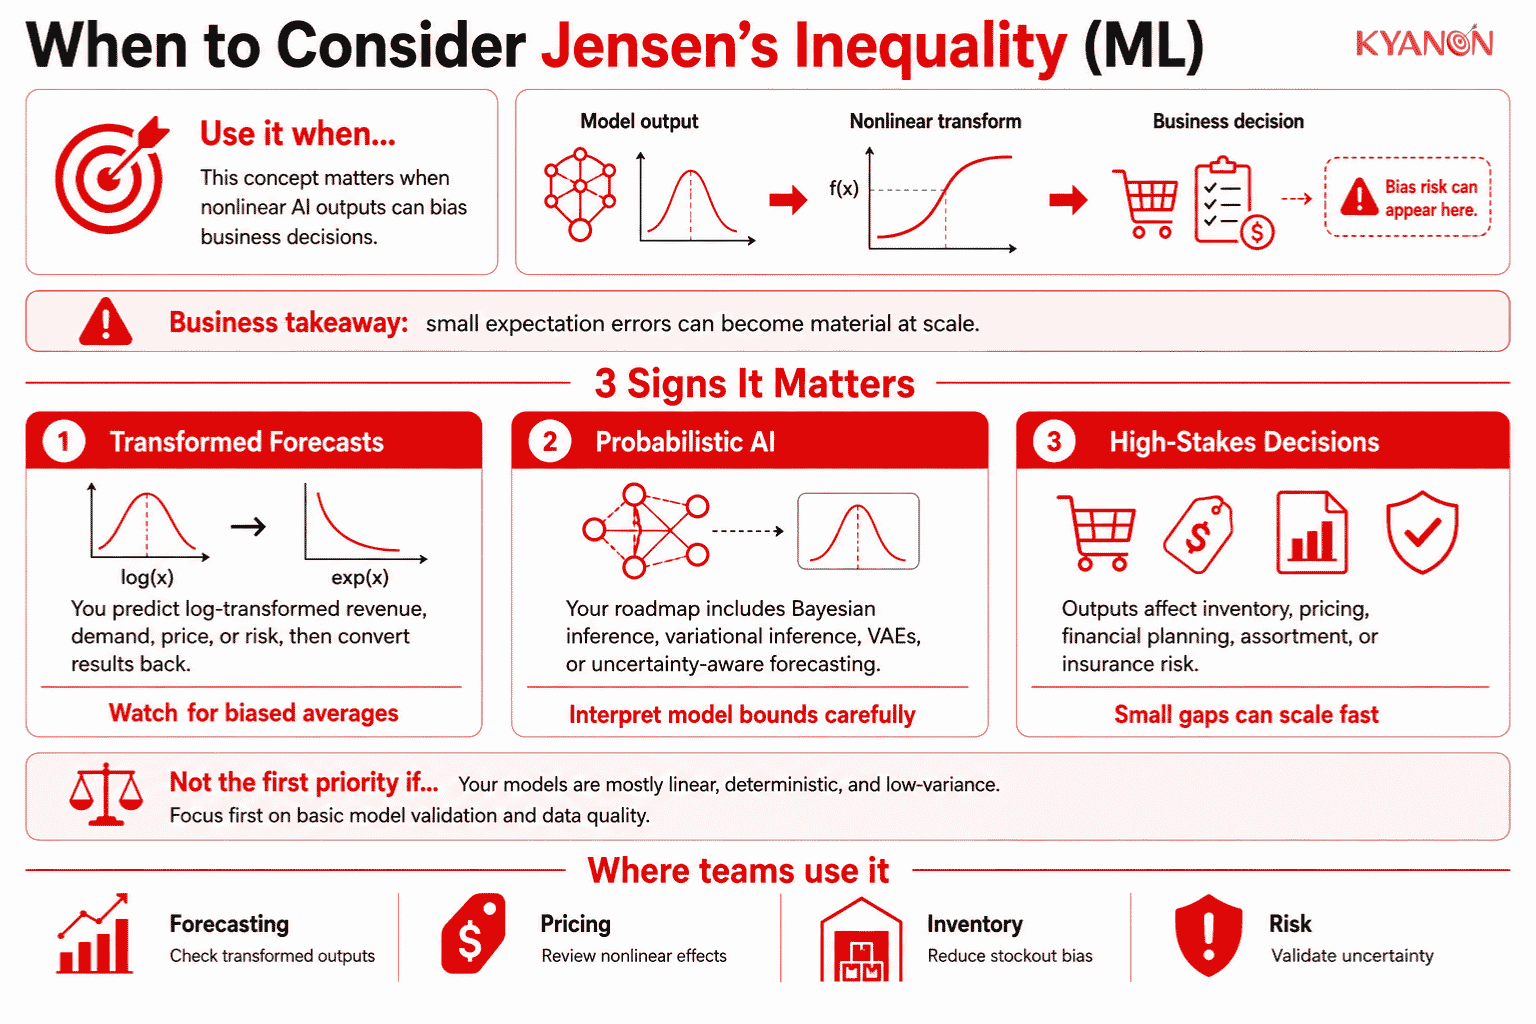
Consider Jensen’s Inequality (ML) if:
- Your forecasting model predicts log-transformed revenue, price, demand, or risk and then converts predictions back into business units. The inverse transformation can systematically understate or overstate the real mean.
- Your AI roadmap includes Bayesian inference, variational inference, VAE-based models, or uncertainty-aware forecasting. These methods often rely on lower bounds or approximations where the Jensen Gap affects interpretation.
- Your team is validating model outputs for financial planning, assortment forecasting, insurance risk, pricing, or inventory decisions. In these contexts, small expectation errors can become material when applied across many SKUs, stores, regions, or customer segments.
It may not be the right priority if:
- Your current model uses only linear transformations, deterministic inputs, and low-variance operational data. In that case, basic model validation and data quality may be more urgent than a Jensen Gap audit.
Why Jensen’s Inequality Matters for Enterprise E-Commerce
For enterprise e-commerce teams, Jensen-aware validation should be part of data and AI consulting for forecasting, personalization, and pricing models, especially when AI outputs affect inventory, promotion, or margin decisions.
According to Gartner’s retail CIO Agenda, 91% of retail IT leaders are prioritizing AI as the top technology to implement by 2026. Gartner also predicts that 70% of large-scale organizations will adopt AI-based forecasting to predict future demand by 2030.
For example, an online retailer may train a demand forecasting model on log-transformed sales to reduce volatility across SKUs. If the business later extrapolates the average predicted log-demand without correcting for uncertainty, the forecast can systematically underpredict actual demand for high-variance products. At scale, this can lead to stockouts, over-discounting, poor replenishment planning, and misleading performance forecasts across categories.
Jensen’s Inequality also matters in personalization and conversion modeling. A recommendation engine may estimate expected conversion uplift across customer segments, but nonlinear scoring can make the average uplift look more reliable than it is. The practical risk is not the formula itself; it is making revenue, inventory, and campaign decisions from model outputs that look precise but are mathematically biased after transformation.
For enterprise e-commerce, Jensen-related errors can affect:
- Inventory planning: underestimating demand for volatile SKUs.
- Pricing: misreading margin exposure after nonlinear price-response modeling.
- Personalization: overestimating conversion uplift across customer segments.
- Promotion planning: misallocating discounts because average uplift looks stronger than actual uplift.
- CLV modeling: undervaluing or overvaluing customers when lifetime value distributions are skewed.
Common Misconceptions
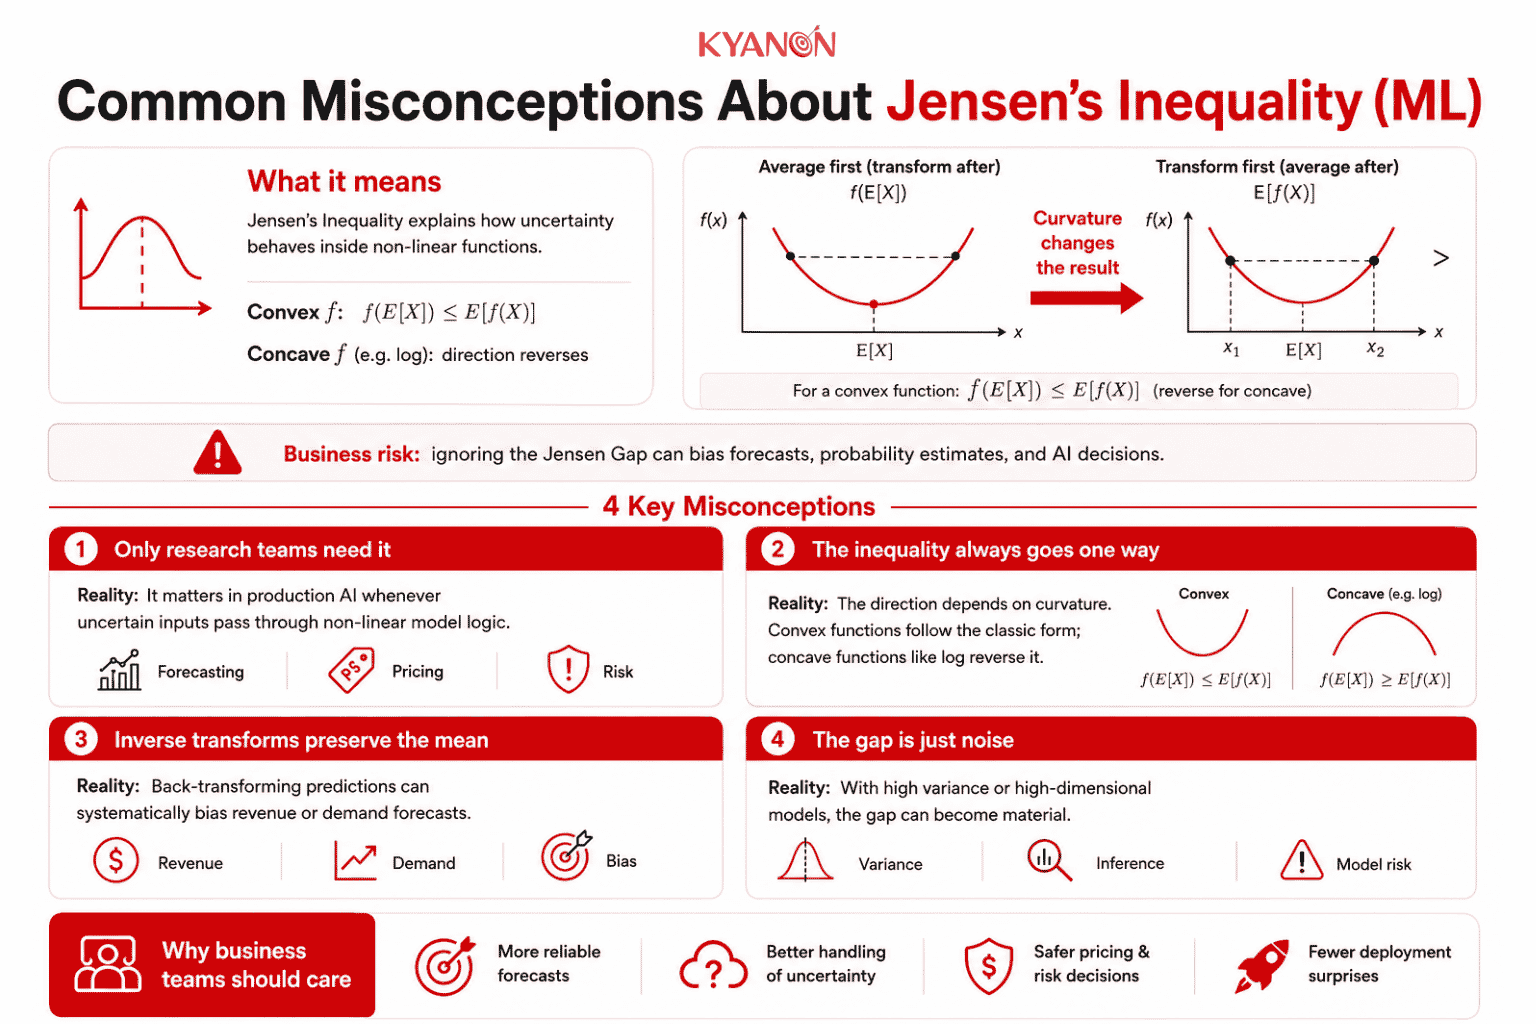
A common executive misconception is that Jensen’s Inequality is only relevant to research teams, but it can affect production AI whenever uncertainty passes through nonlinear model logic.
“The expectation of a function is always greater than the function of the expectation.”
Reality: The relationship depends entirely on the curvature of the function $f$. For a strictly convex function, $f(\mathbb{E}[X])\le\mathbb{E}[f(X)]$, but for a strictly concave function like a log-transform, the direction is entirely reversed.
“Applying a non-linear transform to target variables and inverting it perfectly preserves the mean prediction.”
Reality: Because of the Jensen Gap, taking the mean of your predictions after an inverse transformation forces the model to systematically miscalculate the true mean, leading to biased financial or demand forecasting.
“The gap between the two values is negligible noise.”
Reality: The Jensen Gap scales dramatically in high-dimensional spaces or complex distributions, causing severe estimation failures if ignored in variational inference.
How Kyanon Digital Applies Jensen’s Inequality (ML)
Kyanon Digital applies Jensen-aware validation when designing probabilistic forecasting and uncertainty-aware AI systems for enterprise clients across Southeast Asia, ANZ, and the US. The approach focuses on checking whether transformed model outputs remain reliable after nonlinear transformations, so teams can reduce forecast bias, improve decision confidence, and align AI outputs with business risk thresholds. Our data science approach enforces mathematically rigorous variational inference and corrected non-linear transformations, ensuring that complex demand forecasting and Bayesian models deliver unbiased predictions aligned with exact enterprise risk parameters.
→ Explore our data and AI consulting services for uncertainty-aware enterprise ML.

 Create project brief with AI