What is a regression model?
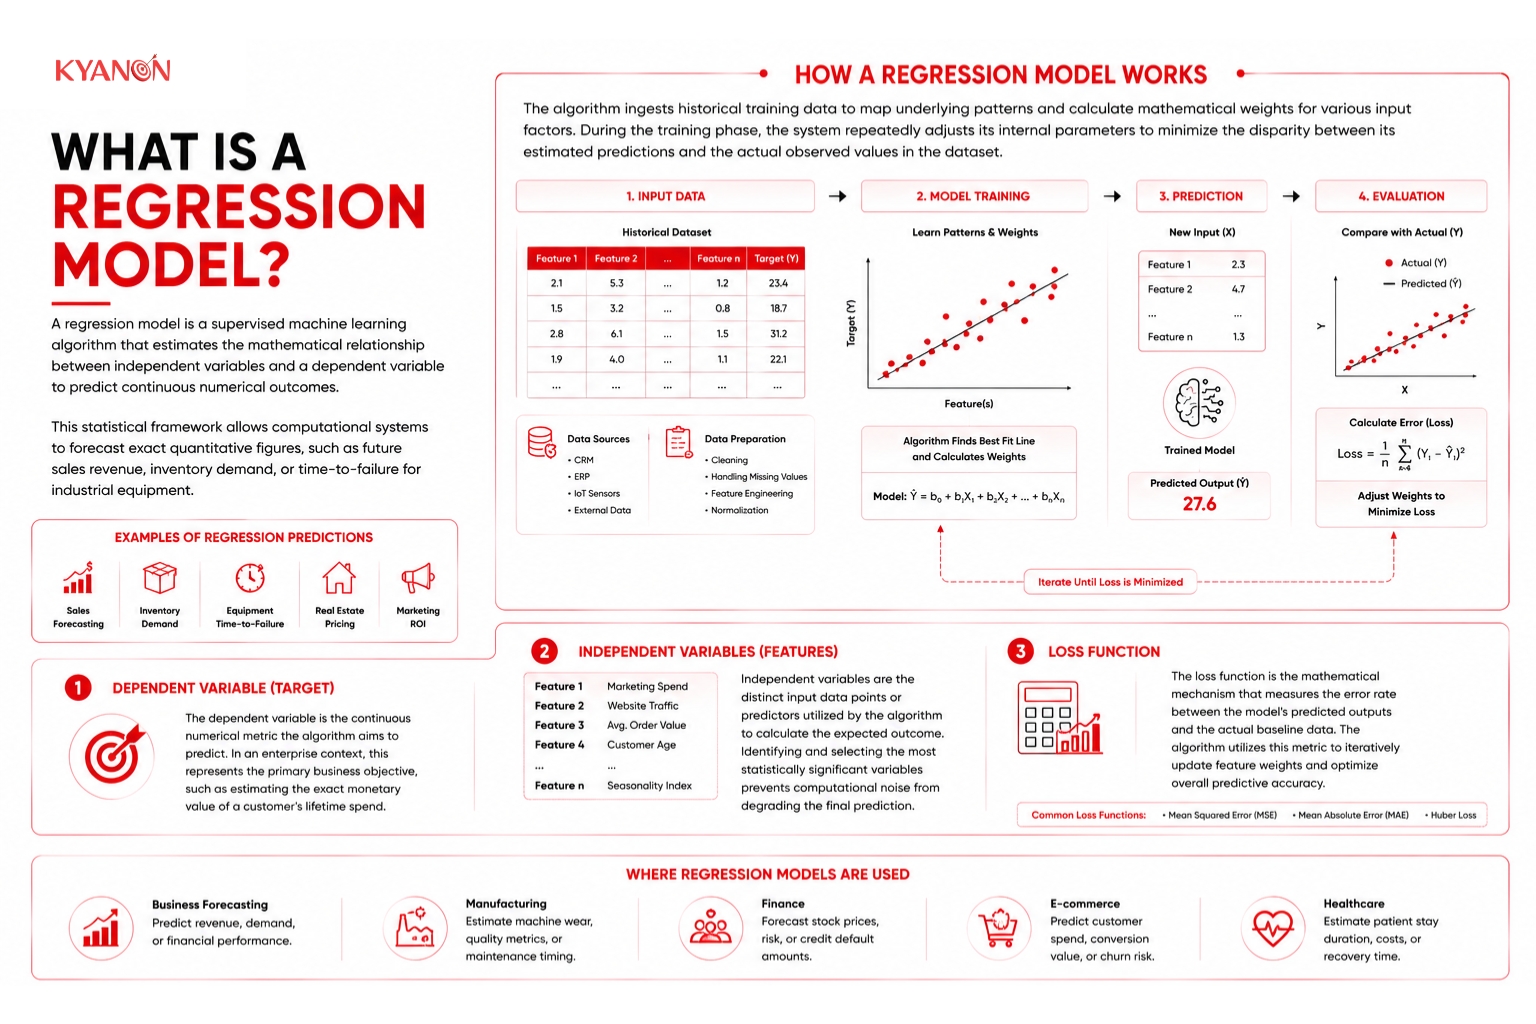
A regression model is a supervised machine learning algorithm that estimates the mathematical relationship between independent variables and a dependent variable to predict continuous numerical outcomes. This statistical framework allows computational systems to forecast exact quantitative figures, such as future sales revenue, inventory demand, or time-to-failure for industrial equipment.
How a regression model works
The algorithm ingests historical training data to map underlying patterns and calculate mathematical weights for various input factors. During the training phase, the system repeatedly adjusts its internal parameters to minimize the disparity between its estimated predictions and the actual observed values in the dataset.
Dependent Variable (Target)
The dependent variable is the continuous numerical metric the algorithm aims to predict. In an enterprise context, this represents the primary business objective, such as estimating the exact monetary value of a customer’s lifetime spend.
Independent Variables (Features)
Independent variables are the distinct input data points or predictors utilized by the algorithm to calculate the expected outcome. Identifying and selecting the most statistically significant variables prevents computational noise from degrading the final prediction.
Loss Function
The loss function is the mathematical mechanism that measures the error rate between the model’s predicted outputs and the actual baseline data. The algorithm utilizes this metric to iteratively update feature weights and optimize overall predictive accuracy.
Regression Model vs Classification Model
Both frameworks utilize supervised machine learning to predict outcomes based on historical data, but they differ fundamentally in the type of output they generate.
|
Dimension |
Regression Model | Classification Model |
| Output Type | Continuous numerical values (infinite possibilities). |
Discrete categorical labels (pre-defined classes). |
|
Primary Goal |
To answer “How much?” or “How many?” | To answer “What kind?” or “Which category?” |
| Common Use Cases | Predicting house prices, forecasting temperature, estimating customer lifetime value. |
Spam detection (spam vs. inbox), medical diagnosis (sick vs. healthy), image recognition (cat vs. dog). |
|
Evaluation Metrics |
Root Mean Square Error (RMSE), Mean Absolute Error (MAE), $R^2$ Score. | Accuracy, Precision, Recall, F1-Score, Confusion Matrix. |
| Classic Algorithms | Linear Regression, Ridge Regression, Lasso Regression. |
Logistic Regression, Support Vector Machines (SVM), Naive Bayes. |
When to consider a regression model
Consider a regression model if:
- Your finance department needs to forecast exact quarterly revenue targets based on varying marketing expenditures and macroeconomic indicators.
- You are attempting to calculate dynamic Customer Lifetime Value (CLV) to allocate specific acquisition budgets per user segment.
- Your supply chain operations require predicting the exact volume of required inventory across multiple distribution centers to prevent stockouts.
It may not be the right priority if:
- Your core operational challenge requires assigning data into strict binary categories, such as automatically approving or rejecting credit applications, which strictly requires a classification approach.
Why a regression model matters for enterprise operations
A regression model is critical for enterprise operations because it transforms raw historical data into exact, mathematically backed predictions, moving corporate decision-making away from human guesswork and toward optimized resource allocation. While generative AI models handle text and imagery, regression models remain the primary computational workhorse for calculating numeric corporate outcomes—such as revenue targets, supply chain inventory levels, and staffing requirements.
Common misconceptions
A high R-squared score means our model will perfectly predict future market conditions
Reality: A high R-squared metric only confirms that the model memorized your historical training data effectively. If the system is overfitted with too many insignificant parameters, it will fail dramatically when deployed to predict new, unseen production data.
We need to dump every available data point and variable into the model to make it more accurate
Reality: Throwing every variable into a predictive pipeline inflates computational noise and introduces multicollinearity. This dilutes the statistical significance of the actual business drivers and leads to highly unstable, unreliable predictions.
A variable with a massive coefficient is automatically the most important factor driving our revenue
Reality: Coefficient sizes depend entirely on the unit scales of the variables being measured. A tiny coefficient applied to a variable measured in millions can be vastly more impactful to the final prediction than a large coefficient applied to a percentage.
How Kyanon Digital applies a regression model
Kyanon Digital integrates the regression model within enterprise predictive analytics architectures for clients across the US, Nordic Europe, ANZ, and Southeast Asia. Our engineering teams deploy supervised learning pipelines to forecast continuous operational metrics, such as revenue projection, customer lifetime value, and equipment failure probability. This approach prioritizes rigorous feature engineering and cross-validation to prevent data overfitting, ensuring predictive accuracy translates directly to improved Total Cost of Ownership (TCO) and optimized resource allocation.
Explore our Machine Learning Services.


")


 Create project brief with AI