What is a Confusion Matrix?
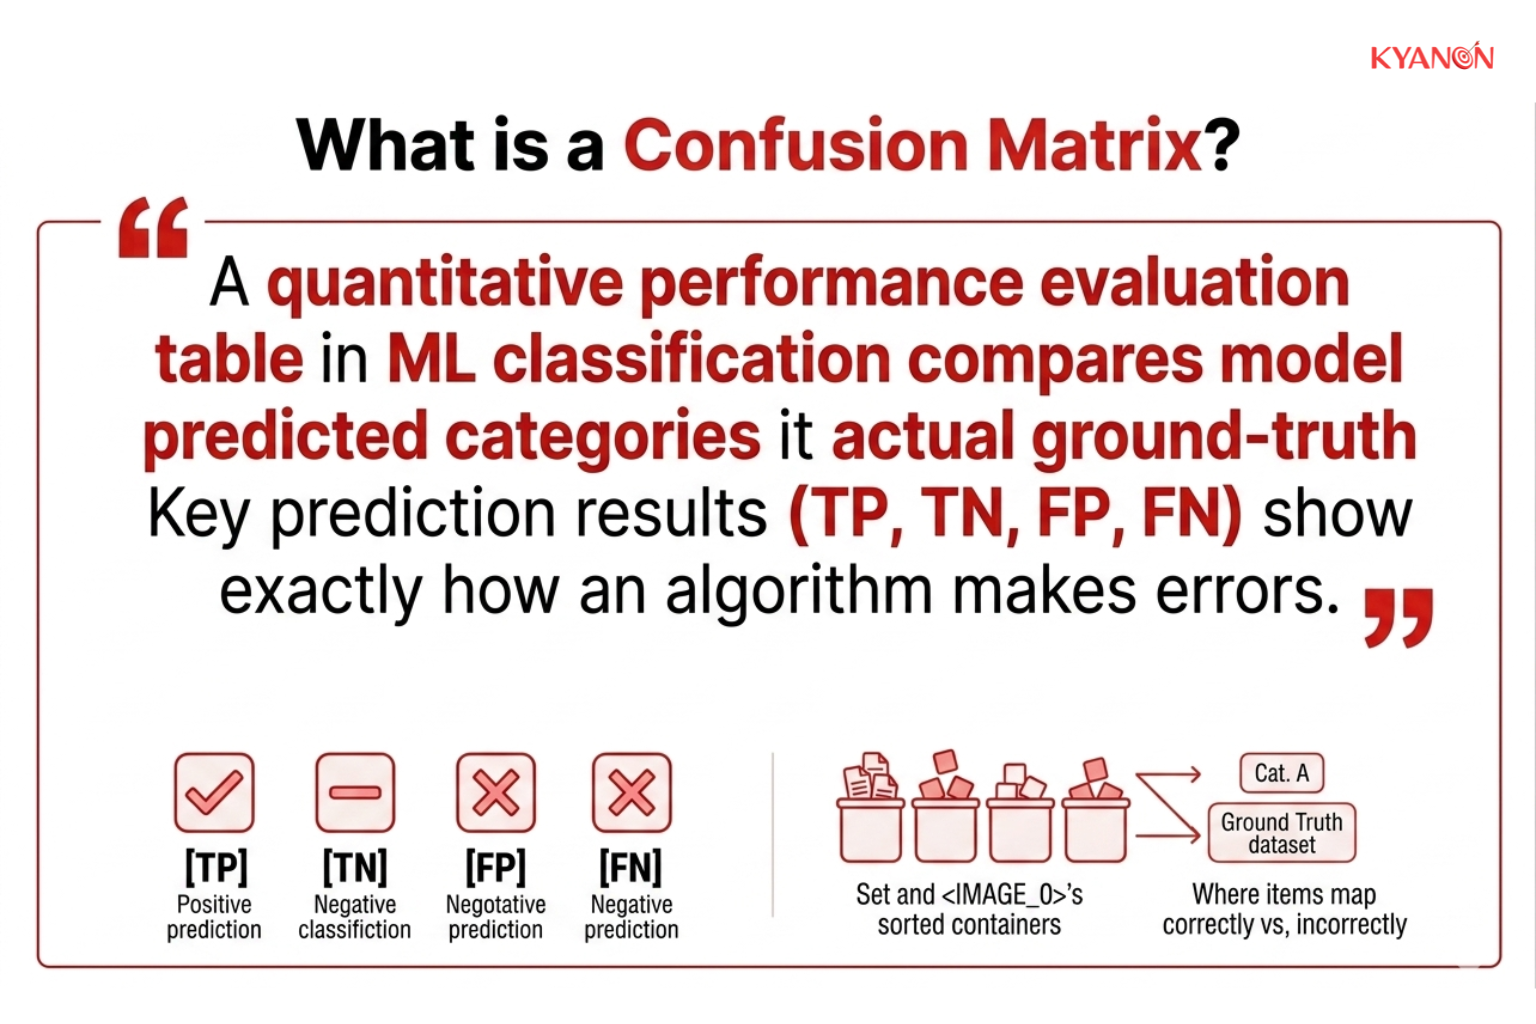
A confusion matrix is a quantitative performance evaluation table used in machine learning classification that compares a model’s predicted categories against the actual ground-truth labels. It breaks down prediction results into true positives, true negatives, false positives, and false negatives, revealing exactly where and how an algorithm is making classification errors.
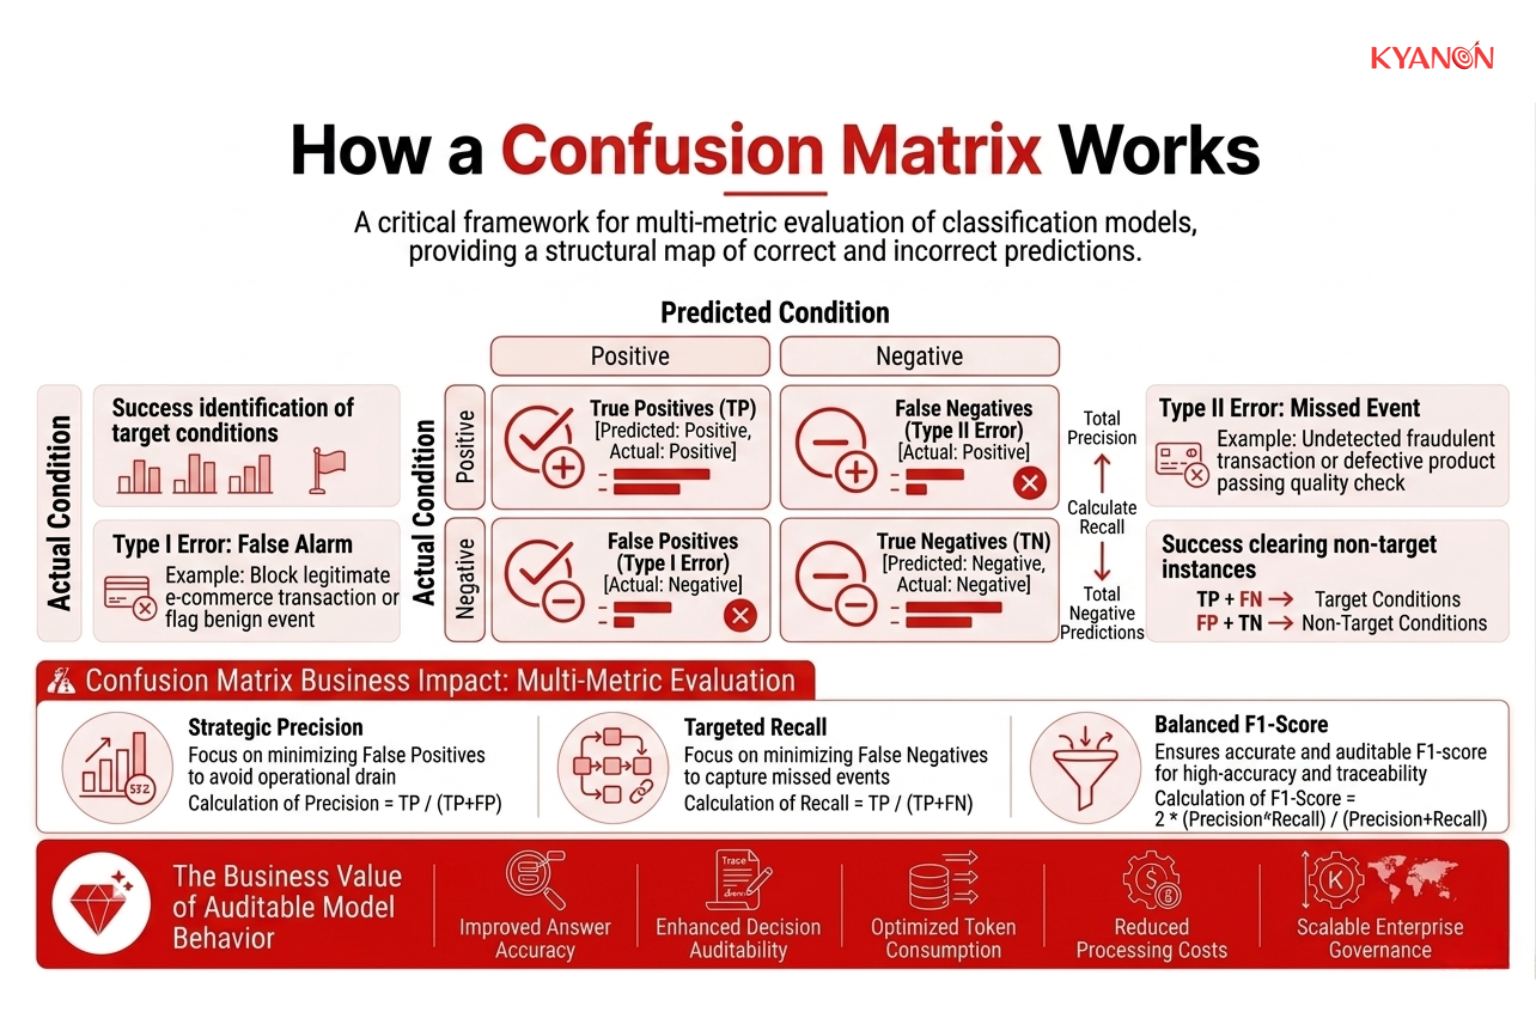
For a binary classification problem (two possible outcomes), the confusion matrix forms a 2×2 grid. The rows typically represent the actual ground-truth labels, while the columns represent the model’s predicted labels (or vice versa, depending on the software library).
| Predicted: Negative (0) | Predicted: Positive (1) | |
| Actual: Negative (0) | True Negative (TN)
Correctly identified as negative. |
False Positive (FP) Incorrectly identified as positive. (Type I Error) |
|
Actual: Positive (1) |
False Negative (FN)
Incorrectly identified as negative. (Type II Error) |
True Positive (TP) Correctly identified as positive. |
- True Positive (TP): The model predicted a positive outcome, and the actual label was positive (e.g., correctly flagging a medical condition).
- True Negative (TN): The model predicted a negative outcome, and the actual label was negative (e.g., correctly clearing a healthy person).
- False Positive (FP): The model predicted a positive outcome, but the actual label was negative (a “false alarm”).
- False Negative (FN): The model predicted a negative outcome, but the actual label was positive (a “missed case”).
How a Confusion Matrix Works
Instead of providing a single aggregate score, this evaluation framework cross-references predictions with actual outcomes to map the exact distribution of model behavior. This structural mapping allows engineering teams to calculate critical secondary metrics, such as precision, recall, and F1-score, that dictate how an algorithm behaves under specific operational constraints.
Key Component 1: True Positives (TP) and True Negatives (TN)
True Positives and True Negatives represent the model’s correct decisions, meaning cases where it predicts accurately.
- True Positives (TP): The model correctly identifies a positive outcome, such as detecting fraud when fraud is actually present.
- True Negatives (TN): The model correctly identifies a negative outcome, such as approving a legitimate transaction that should not be flagged.
When both TP and TN values are high, it indicates strong overall performance. The model is not only successfully detecting the cases it should catch, but also correctly ignoring normal or non-problematic cases. This balance reduces the need for human review and improves operational efficiency.
Key Component 2: False Positives (Type I Errors)
False positives occur when the model incorrectly predicts a positive result even though the real case is negative.
In other words, the system raises a warning or takes action when it shouldn’t. In real-world applications, this can lead to issues such as:
- Blocking legitimate customer transactions by mistake
- Flagging normal system behavior as suspicious activity
- Denying access or service to valid users
While false positives may seem safer than missing issues, they still create significant problems. They increase unnecessary workload for teams, slow down operations, and can frustrate users who are incorrectly flagged.
Key Component 3: False Negatives (Type II Errors)
False negatives happen when the model fails to identify a positive case that is actually present.
This means a real issue goes undetected. Examples include:
- Fraudulent transactions that are not detected
- Product defects that pass quality control checks
- Security threats that are not flagged by the system
False negatives are often considered more serious in high-risk environments because the system provides no warning at all. As a result, they can lead to financial losses, compliance violations, or security breaches since the problem remains hidden instead of being addressed.
Confusion Matrix vs Classification Report
Both a confusion matrix and a classification report are used to evaluate machine learning models, but they serve different purposes and present information in distinct ways.
A confusion matrix focuses on showing raw prediction outcomes in a structured grid, while a classification report summarizes performance using calculated evaluation metrics.
|
Dimension |
Confusion Matrix | Classification Report |
| Format | N x N grid of raw prediction counts |
Tabular summary of calculated metrics |
|
Primary output |
Absolute numbers of correct and incorrect predictions | Precision, recall, F1-score, and support values |
| Core objective | Visualizing the exact error distribution between classes |
Comparing statistical performance across multiple classes |
|
Interpretability |
Requires understanding of matrix axes (Predicted vs Actual) | Requires statistical literacy regarding ML metrics |
| Granularity | Instance-level prediction breakdown |
Class-level aggregate statistics |
In short, the confusion matrix helps you see where errors happen and how they are distributed, while the classification report helps you understand how well each class performs using standardized metrics.
When to Consider a Confusion Matrix
A confusion matrix is most useful when you need to understand how a classification model is making mistakes, not just how accurate it is overall.
Consider a confusion matrix if:
- Your recently deployed fraud detection algorithm is blocking a high volume of legitimate customer transactions, leading to elevated customer support complaints.
- Your engineering team is building an automated diagnostic or defect detection model where the business cost of missing an anomaly is significantly higher than raising a false alarm.
- Your current classification model reports 95% accuracy, but the business unit utilizing it reports that it fails entirely on minority edge cases.
It may not be the right priority if:
- Your organization is primarily utilizing regression models to forecast continuous numerical values, such as quarterly inventory demand, which require continuous error metrics like RMSE.
Why a Confusion Matrix Matters for Enterprise AI
Relying solely on overall accuracy scores obscures critical vulnerabilities in AI deployments, particularly when the financial consequences of different error types are fundamentally unequal.
A confusion matrix becomes essential because it breaks performance down into specific outcomes: true positives, true negatives, false positives, and false negatives. Instead of giving a single score, it shows exactly how the model behaves in different situations. This makes it possible to see not only whether the model is correct, but also where and how it is failing.
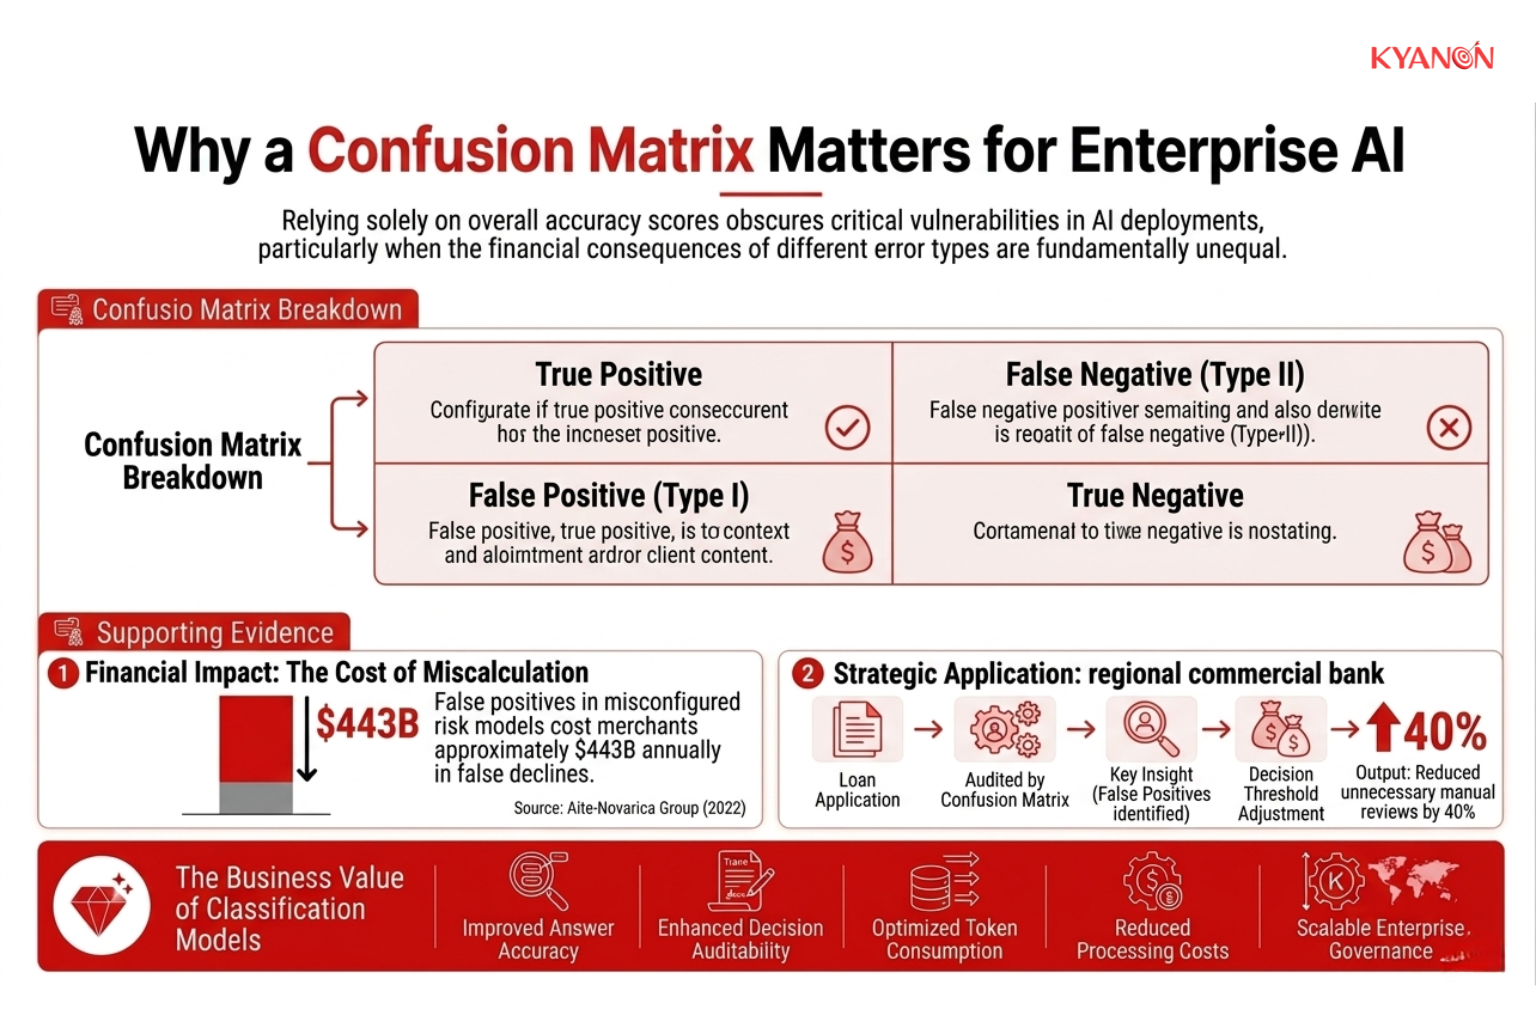
This level of detail is especially important in enterprise use cases where the cost of errors is not symmetrical. False positives, such as incorrectly blocking a legitimate transaction or flagging normal behavior as suspicious, can directly impact customer experience and increase operational workload. On the other hand, false negatives, such as failing to detect fraud, defects, or security threats, can lead to financial loss, compliance issues, or reputational damage. A confusion matrix makes these trade-offs visible, allowing teams to decide which type of error is more acceptable based on business priorities.
In practice, organizations use confusion matrices to fine-tune model behavior. For example, a bank evaluating a loan approval system may find that, despite high accuracy, the model is incorrectly rejecting too many qualified applicants. By analyzing the confusion matrix, they can adjust the decision threshold to reduce false positives, which decreases unnecessary manual reviews while still maintaining compliance and acceptable risk levels. The result is a more balanced system that improves efficiency without increasing exposure to risk.
Common Misconceptions
Misconception 1: “A 95% accuracy score means our model is highly reliable and ready for deployment.”
Reality: Accuracy is mathematically misleading on imbalanced enterprise datasets. If 99% of your data belongs to a single “normal” category and the model simply defaults to predicting that category every time, it achieves 99% accuracy while possessing zero predictive power for the actual anomaly you need to detect.
Misconception 2: “All model prediction errors carry the exact same weight and business consequence.”
Reality: The financial and operational cost of errors is heavily context-dependent. A false positive (false alarm) might cost a few dollars in manual review time, while a false negative (missed fraud) could cost millions in liability, necessitating targeted threshold adjustments.
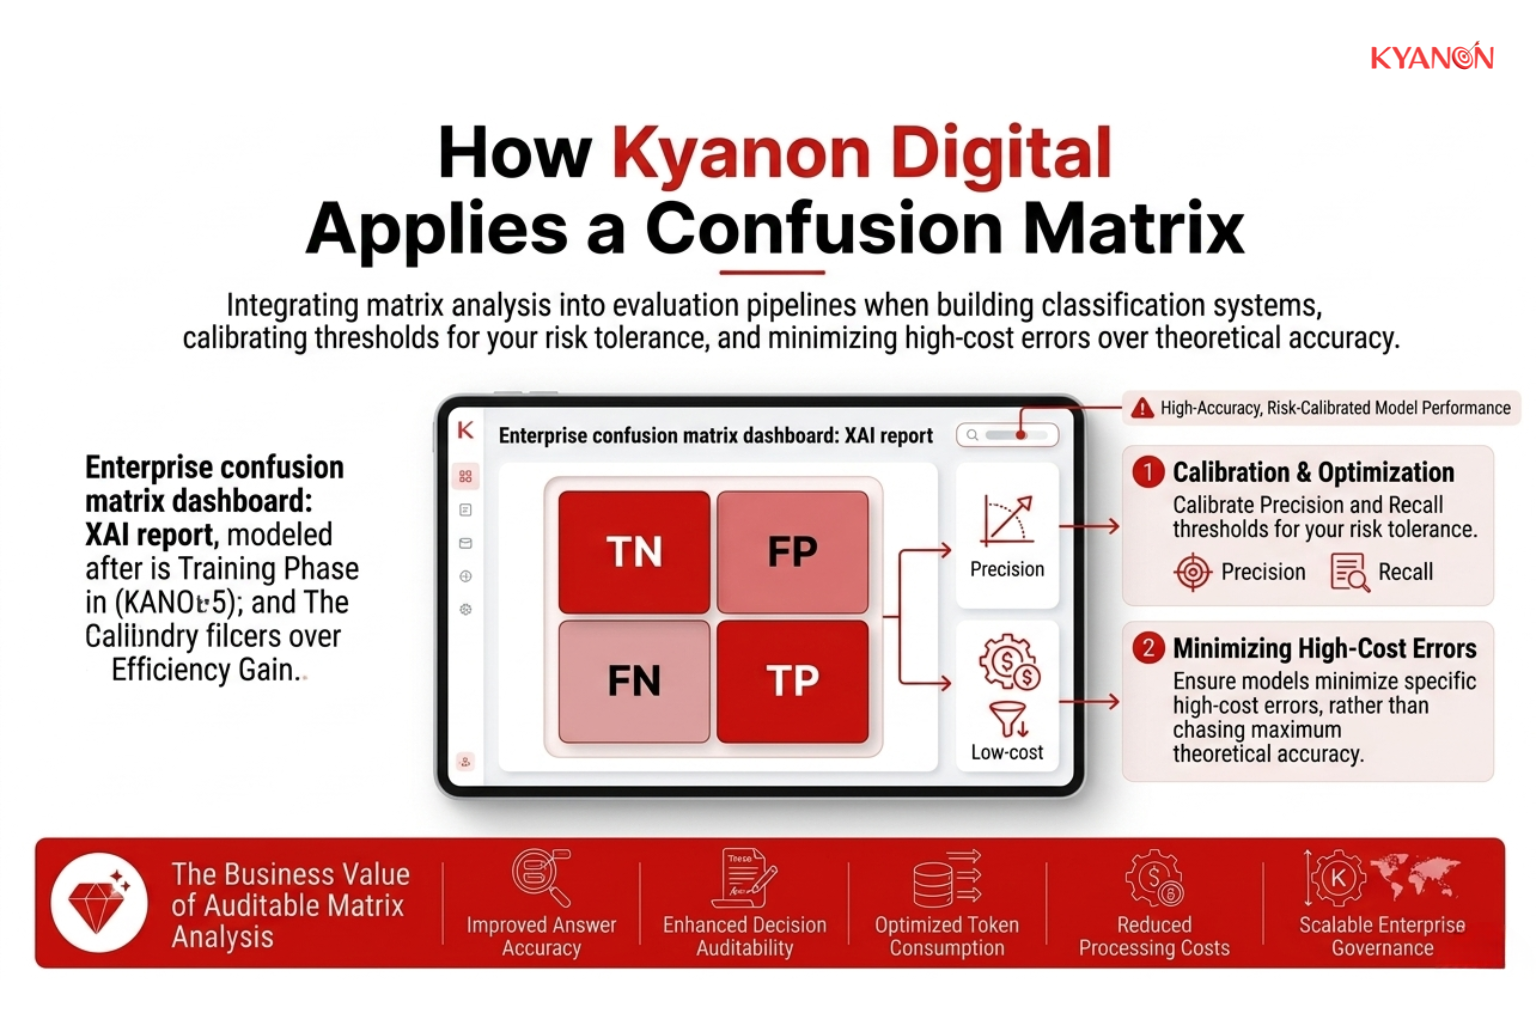
How Kyanon Digital Applies a Confusion Matrix
Kyanon Digital incorporates comprehensive confusion matrix analysis into our model evaluation pipelines when building classification systems for enterprise clients in retail, banking, and human resources. Our engineering teams leverage this breakdown to calibrate precision and recall thresholds specifically for your risk tolerance, ensuring that deployed models minimize high-cost errors rather than simply chasing theoretical accuracy.
→ Explore our Artificial Intelligence Software Development services.


")


 Create project brief with AI