

Exploratory data analytics helps businesses turn raw data into trusted insights by detecting data quality issues, hidden patterns, anomalies, and relationships before dashboards, AI models, or business decisions are made.
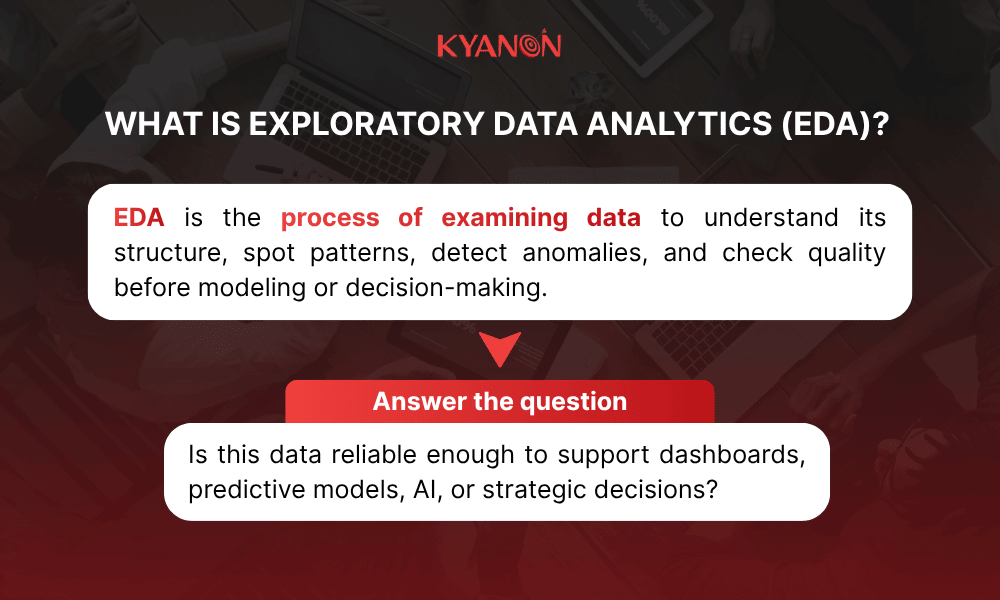
Exploratory data analysis (EDA) is the process of examining datasets to summarize their main characteristics, spot anomalies, and identify patterns before formal modeling or decision-making begins.
For businesses, the value is simple: EDA helps reduce the risk of wrong dashboards, wrong predictive models, and wrong strategic decisions.
As enterprises invest more in data analytics, AI, automation, and business intelligence, data quality has become a business priority. Grand View Research estimates the global data analytics market will grow from US$69.54 billion in 2024 to US$302.01 billion by 2030, while Gartner predicts that 60% of AI projects without AI-ready data will be abandoned through 2026.
Most organizations already collect data across finance, sales, operations, marketing, customer service, product systems, and supply chains. The real challenge is knowing whether that data is accurate, complete, consistent, and meaningful enough to support action.
That is where exploratory data analytics matters. It helps businesses validate raw data, uncover useful patterns, and understand what the data is really showing before investing in dashboards, predictive analytics, AI workflows, or automation. In Kyanon Digital’s data and BI engagements, the most common issue is not a lack of data. It is that teams often move into dashboards, automation, or AI models before confirming whether the data is accurate, consistent, and meaningful enough to support business decisions.
This article explains what exploratory data analytics is, why it matters, how it works, which tools to consider, and how it connects to predictive data analytics.
Key Takeaways
- Exploratory data analytics is the first serious step between raw data and reliable business insight.
- EDA helps businesses detect missing values, duplicates, outliers, inconsistent definitions, and hidden relationships before decisions are made.
- EDA is not only a data science task. It is a business decision-making workflow that reduces the risk of wrong dashboards, wrong models, and wrong strategy.
- The four core EDA techniques are univariate non-graphical, univariate graphical, bivariate or multivariate non-graphical, and bivariate or multivariate graphical analysis.
- EDA should happen before predictive data analytics, machine learning, AI automation, or high-stakes business reporting.
- AI-augmented analytics tools can speed up EDA, but human judgment is still needed to define the right business question and validate the commercial meaning of findings.
- The right EDA tool depends on the use case: Python or R for deep analysis, BI tools for recurring exploration, and AI-augmented platforms for faster self-service analytics.
What Is Exploratory Data Analytics (EDA)?
Exploratory data analytics, or EDA, is the process of analyzing datasets to summarize their main characteristics, uncover structure, detect outliers or anomalies, and understand patterns before formal modeling or hypothesis testing begins.
This definition aligns with IBM’s explanation of EDA as a way to investigate datasets and discover patterns or anomalies and NIST’s description of EDA as an approach for maximizing insight into data and uncovering underlying structure.
Business framing: exploratory data analytics is not just a data science activity. It is the step that helps businesses decide whether the data is ready to support investment in predictive models, AI, automation, or high-stakes decisions
EDA vs. confirmatory analysis
|
Criteria |
Exploratory data analytics |
Confirmatory analysis |
| Purpose | Discover patterns and generate hypotheses |
Test a specific hypothesis |
|
Logic |
Inductive |
Deductive |
|
Main question |
What does the data tell me? | Does the data prove what I think? |
| Starting point | Open exploration |
Predefined assumption |
|
Output |
Signals, anomalies, relationships, hypotheses | Validation, rejection, or statistical proof |
| Business timing | Before dashboards, predictive models, AI, or major decisions |
After a clear hypothesis is defined |
Exploratory data analysis differs from confirmatory analysis because EDA explores data without preconceived conclusions, whereas confirmatory analysis tests whether a specific assumption is true. EDA helps businesses identify which questions to ask before investing in predictive analytics, AI, or data-driven decision-making.
- For data teams, EDA is the workflow for profiling data, checking quality, spotting outliers, comparing variables, and preparing datasets for deeper analysis.
- For business leaders, EDA is a risk-control step. It helps answer whether the data is reliable enough to guide investment, automation, reporting, or strategy.
From Kyanon Digital’s perspective, EDA is where business questions meet data reality. It helps teams check whether the data can truly support the decision being made, instead of simply assuming that available data is usable data.
Why Businesses Are Sitting on Data Gold They Can’t Access
Most enterprises have more data than they know what to do with. The problem isn’t data volume; it’s data comprehension. Raw datasets are full of noise, missing values, and hidden patterns that only become visible when you know how to look.
Most enterprises are not short of data. They are short of usable evidence.
Harvard Business Review also noted that, on average, less than half of structured data is actively used in decision-making, and less than 1% of unstructured data is analyzed or used at all. This is the real gap between “we have data” and “we have insights.”
Businesses may store years of customer, finance, sales, operations, product, supply chain, and service data. But without a structured process to explore it, valuable signals stay buried inside noisy datasets, inconsistent definitions, missing values, outliers, and disconnected systems.
Exploratory data analytics helps bridge that gap.
EDA is not just a dashboard, chart, or technical tool. It is a mindset and workflow for asking better questions, profiling data, checking assumptions, spotting anomalies, and translating patterns into business meaning.
- For business leaders, EDA answers: What should we trust before making a decision?
- For data teams, EDA answers: What must be cleaned, validated, segmented, or investigated before analysis goes further?
The stakes are practical. Skipping EDA can lead teams to build dashboards around weak metrics, train models on noisy data, or make strategic decisions based on surface-level trends.
For example, a revenue drop may look like a sales problem. EDA may reveal that the real issue is pricing leakage, delayed invoicing, stock gaps, regional demand changes, or customer churn. A productivity decline may look like a people problem. EDA may show workflow bottlenecks, duplicated tasks, system downtime, or poor process design.
This is why leading companies treat data exploration as part of decision-making, not a separate technical exercise. UPS used analytics through its ORION route optimization system to reduce unnecessary delivery miles and improve operational efficiency. Netflix has used experimentation and data analysis for more than 20 years to test product decisions before scaling changes.
Kyanon Digital often sees enterprises with large volumes of data but limited usable insight because definitions, ownership, and data structures are not aligned across departments. EDA helps expose these gaps before they become reporting or AI risks.
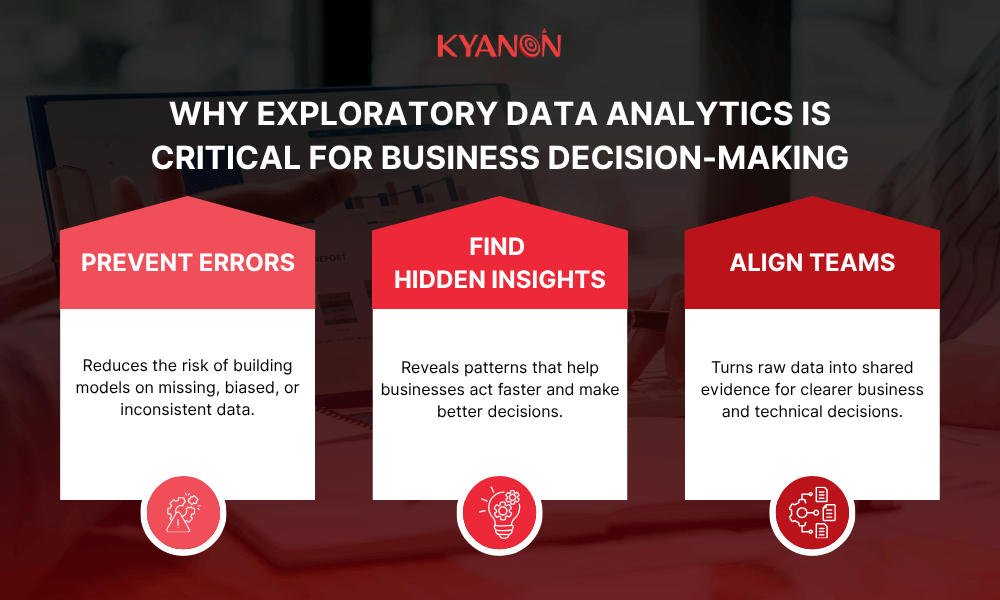
Why Exploratory Data Analytics Is Critical for Business Decision-Making
EDA matters because it reduces uncertainty before money, time, and resources are committed.
Gartner states that through 2025, poor data quality will remain one of the most frequently mentioned challenges preventing advanced analytics and AI deployment, while its 2025 AI-ready data research also predicts that 60% of AI projects unsupported by AI-ready data will be abandoned through 2026.
Prevents Costly Modeling Mistakes
A predictive model built on dirty or misunderstood data will produce misleading outputs. The model may look accurate in testing but fail when applied to real business conditions.
EDA helps businesses check the following:
- Are there missing values?
- Are duplicates inflating results?
- Are outliers errors or important signals?
- Are time periods comparable?
- Are customer segments represented fairly?
- Are business definitions consistent across systems?
Example: Amazon reportedly discontinued an AI recruiting tool after finding that the model learned bias from historical hiring data and downgraded resumes containing words associated with women, showing how flawed or unbalanced training data can create misleading model outputs.
Business impact: EDA prevents avoidable budget waste by catching data issues before analytics investments scale.
Uncovers Insights No One Was Looking For
Confirmatory analysis tests what the business already suspects. EDA finds what the business may not know to ask.
Example: Walmart mined sales data before Hurricane Frances and found that strawberry Pop-Tarts sold about 7 times more than usual before hurricanes, a pattern the business may not have predicted from assumptions alone.
Business impact: EDA helps businesses uncover hidden demand signals, adjust inventory or operations faster, and act on real customer behavior instead of surface-level assumptions.
Speaks Both Technical and Business Languages
Raw tables are hard to interpret. EDA turns data into summaries, patterns, and visuals that help business and technical teams discuss the same evidence.
Strong EDA outputs help data teams explain data quality, business teams understand patterns, finance teams evaluate investment value, and operations teams identify root causes faster.
Example: Kyanon Digital helped a forestry and wood products company standardize fragmented data, build ETL pipelines, and deliver Power BI dashboards so teams could move from manual reports to faster, more consistent decision-making.
Business impact: EDA creates a shared language between data teams and business leaders, reducing metric debates and helping teams act on trusted insight instead of assumptions.
In Kyanon Digital’s experience, dashboards show performance, but EDA explains whether the numbers are trustworthy. This is why EDA should happen before teams commit budget, resources, or strategy based on analytics outputs.
Full case study here: Building a Scalable Data Standardization & BI Framework for a Leading Forestry & Wood Products company.
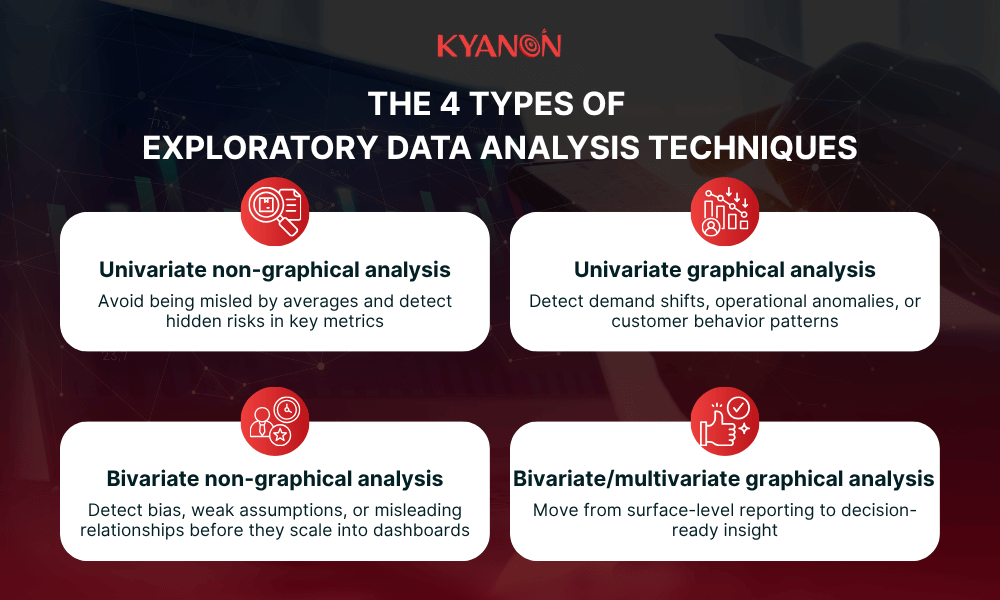
The 4 Types of Exploratory Data Analysis Techniques
The four main types of exploratory data analysis are univariate non-graphical, univariate graphical, bivariate or multivariate non-graphical, and bivariate or multivariate graphical analysis.
Exploratory data analytics techniques are usually grouped by two factors: the number of variables and the analysis format.
|
EDA technique |
What it means | Business value |
| Univariate non-graphical | Studies one variable using statistics |
Understand one metric clearly before deeper analysis |
|
Univariate graphical |
Studies one variable using charts | Spot distributions, spikes, gaps, and outliers faster |
| Bivariate / multivariate non-graphical | Studies relationships between two or more variables using statistics |
Check whether metrics move together before modeling |
|
Bivariate / multivariate graphical |
Visualizes relationships between two or more variables |
Explain complex patterns clearly to business stakeholders |
Univariate non-graphical analysis
Univariate non-graphical analysis examines one variable at a time using statistics such as mean, median, range, variance, standard deviation, skewness, or percentiles.
- When to use it: Use it at the start of analysis to understand the basic profile of one metric before comparing it with others.
- Example: Google’s Site Reliability Engineering guidance uses latency percentiles such as the 50th, 95th, and 99th percentiles to understand service performance beyond simple averages.
- Business impact: This helps teams avoid being misled by averages and detect hidden risks in key metrics such as response time, deal size, delivery time, or cost.
Univariate graphical analysis
Univariate graphical analysis also examines one variable but uses charts such as histograms, box plots, bar charts, line charts, or distribution plots.
- When to use it: Use it when teams need to quickly see outliers, abnormal spikes, gaps, or unusual distribution patterns.
- Example: Uber built uVitals to monitor operational performance metrics and detect anomalies across airport trips, showing how visualizing one metric over time can reveal abnormal patterns before they become larger service issues.
- Business impact: This helps businesses detect demand shifts, operational anomalies, or customer behavior patterns that are hard to see in raw tables.
Bivariate/multivariate non-graphical analysis
Bivariate analysis examines two variables. Multivariate analysis examines three or more variables. Non-graphical methods include correlation, cross-tabulation, covariance, and grouped statistics.
- When to use it: Use it before building a predictive model or making a business conclusion based on relationships between metrics.
- Example: Amazon discontinued an experimental AI recruiting tool after it learned biased patterns from historical hiring data, showing why relationships in data must be checked before models are trusted.
- Business impact: This helps teams detect bias, weak assumptions, or misleading relationships before they scale into dashboards, models, or automated decisions.
Bivariate/multivariate graphical analysis
Bivariate or multivariate graphical analysis visualizes relationships across multiple variables using scatter plots, heatmaps, bubble charts, grouped charts, or cluster charts.
- When to use it: Use it when teams need to explain complex relationships across customers, products, regions, time periods, operations, or costs.
- Example: UPS used its ORION route optimization system to analyze route variables and improve delivery efficiency, with reported reductions of six to eight miles per route for drivers using ORION routes.
- Business impact: This helps businesses move from surface-level reporting to decision-ready insight by showing how multiple factors interact.
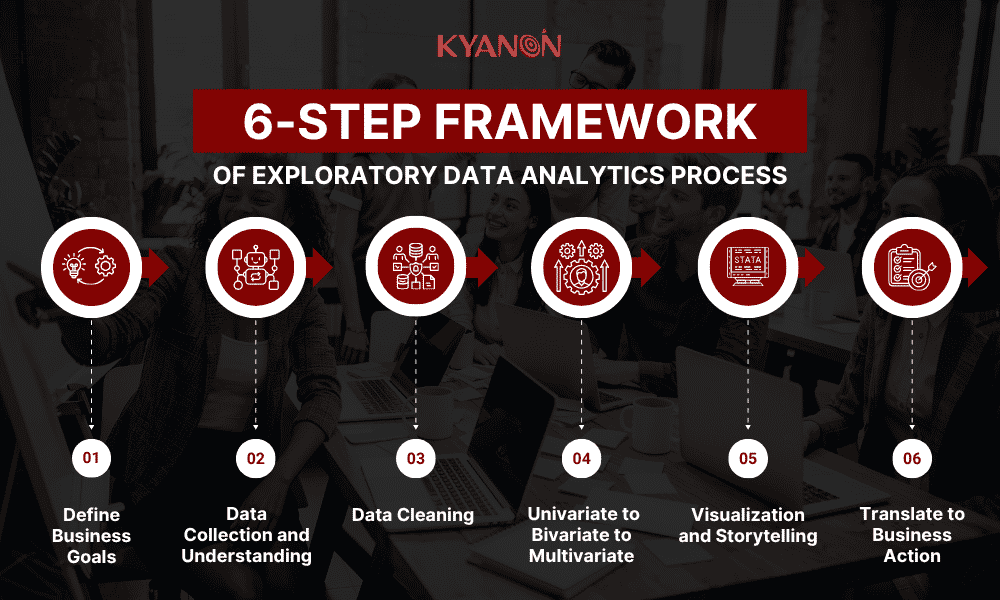
The Exploratory Data Analytics Process: A Step-by-Step Framework
EDA works best when it follows a clear sequence. The process should be flexible, but not random.
Step 1: Define Business Goals
Before touching the data, define the business question.
Examples:
- Why did churn increase last quarter?
- Which customer segment drives the most lifetime value?
- Why did product returns rise after a promotion?
- Which sales channel produces profitable growth?
- Are delivery delays affecting repeat purchases?
Common mistake: starting with data exploration before defining the decision that needs support.
Output:
- A written problem statement
- A list of initial hypotheses
- A decision scope
- A clear owner for interpreting the findings
Step 2: Data Collection and Understanding
Next, gather relevant data sources.
Common enterprise sources include:
- CRM
- POS
- ERP
- Web analytics
- Mobile app analytics
- Customer service systems
- Product catalog
- Inventory systems
- Payment data
- Survey data
- Marketing platforms
Key checks:
- How many rows and columns are available?
- What does each field mean?
- What is the time range?
- Which fields are numerical, categorical, date-based, or text-based?
- How was the data collected?
- Are there known system changes during the analysis period?
Red flag: if different departments collect the same metric differently, the business has integration debt before analysis even begins.
Step 3: Data Cleaning
Data cleaning is often the most time-consuming part of EDA.
Typical activities include:
- Handling missing values
- Removing or investigating duplicates
- Correcting inconsistent data types
- Standardizing naming conventions
- Checking impossible values
- Reviewing outliers
- Documenting assumptions
Important principle: do not automatically delete outliers. In business data, outliers may represent fraud, high-value customers, supply chain failures, pricing errors, or emerging demand signals.
For Kyanon Digital, data cleaning is not only a technical task. Missing values, duplicates, inconsistent naming, and outliers often point to deeper business issues such as manual workflows, disconnected systems, or unclear data ownership.
Step 4: Core Analysis: Univariate to Bivariate to Multivariate
A practical EDA sequence is:
- Understand each variable individually.
- Compare two variables.
- Explore multiple variables together.
- Segment the data by time, customer, product, region, or channel.
- Document observations before drawing conclusions.
At this stage, avoid overclaiming. EDA should produce statements such as:
- “We observe that returns are higher in this product group.”
- “Revenue decline appears concentrated in one channel.”
- “Repeat purchase behavior differs by delivery speed.”
- “The data suggests a relationship worth testing.”
EDA generates evidence-based hypotheses. It does not automatically prove causation.
Step 5: Visualization and Storytelling
Visualization turns numerical findings into decision-ready insight.
Good EDA visualization follows one rule:
One chart should communicate one insight.
Examples:
- Histogram: customer order value distribution
- Box plot: outliers in delivery time
- Heatmap: correlation between pricing, conversion, and margin
- Line chart: weekly revenue movement
- Bar chart: return rate by product category
- Scatter plot: acquisition cost vs. customer lifetime value
For technical teams, detailed heatmaps and pair plots may be useful. For business stakeholders, simple bar charts, trend lines, and segmented comparisons often work better.
The goal is not to create more charts. The goal is to make the business decision clearer.
Step 6: Translate to Business Action
EDA should not end with “interesting findings.” It should produce action.
- Data quality risks
- Confidence level
- Business interpretation
- Recommended next steps
- Questions that need further testing
- Decision options
- Whether predictive modeling is justified
Example actions:
- Adjust promotion strategy.
- Investigate a logistics partner.
- Fix product data taxonomy.
- Improve customer segmentation.
- Delay AI modeling until data quality improves.
- Build a predictive churn model using validated features.
- Redesign dashboards around trusted business definitions.
The real value of exploratory data analytics is not the analysis itself. It is the business decision that becomes safer, faster, and better informed.
The strongest EDA output is not a set of charts. It is a decision backlog that shows what the business can trust, what needs further validation, and what action should come next.
How Kyanon Digital Turned Fragmented Data Into Decision-Ready BI
Kyanon Digital helped a government-backed market development agency transform fragmented trade and market data into a scalable BI framework by standardizing data, building automated pipelines, and enabling Power BI reporting for faster business decisions.

Challenges
- Trade and market data was spread across multiple sources, formats, and reporting cycles.
- Manual Excel-based workflows slowed down reporting and increased the risk of errors.
- Inconsistent naming conventions, units of measure, and product classifications created reporting discrepancies.
- Lack of standardized reference data and clear definitions reduced data reliability and auditability.
- Existing data processes could not scale with growing data volumes or future market expansion.
Solutions
- Conducted a data audit to identify source systems, workflow gaps, dependencies, and data quality issues.
- Designed a unified data model across multiple data sources.
- Standardized data structures, classifications, definitions, and business rules.
- Built automated ETL pipelines to reduce manual processing effort.
- Created a centralized data repository as a single source of truth.
- Developed Power BI dashboards with drill-down capabilities for leadership and business teams.
- Designed the architecture for Vietnam and India, with scalability for future HQ rollout.
Results and business impacts
- Reduced manual effort in data consolidation, processing, and reporting.
- Improved data accuracy, consistency, and reliability across markets.
- Enabled faster, insight-driven reporting through Power BI dashboards.
- Created a scalable BI ecosystem for future expansion.
- Improved leadership visibility into trade and market performance.
- Delivered a production-ready BI framework within 12 weeks.
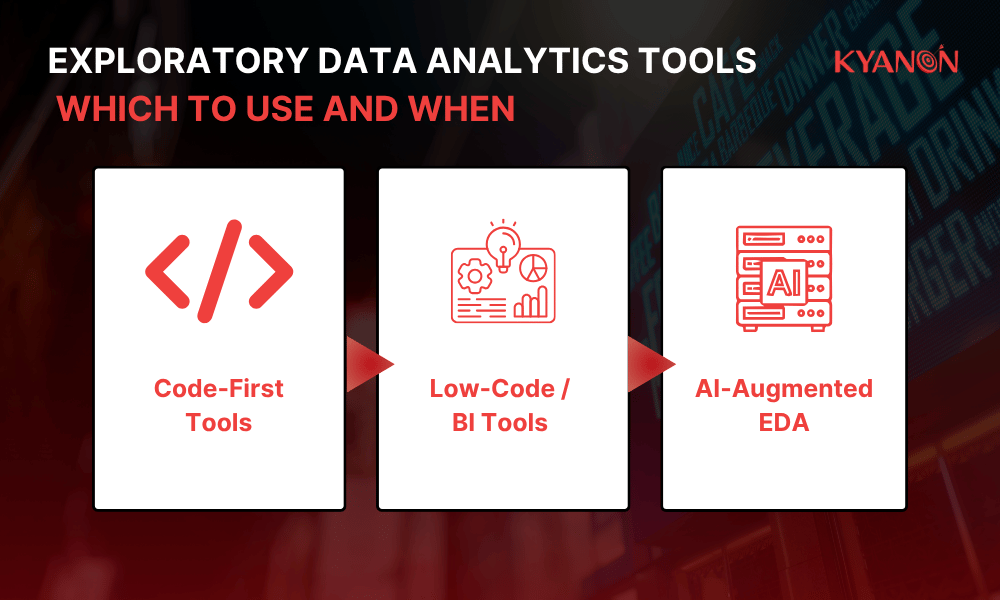
Exploratory Data Analytics Tools: Which to Use and When
Kyanon Digital recommends choosing EDA tools based on business maturity, not tool popularity. BI platforms are useful for recurring visibility, code-first tools are better for deeper investigation, and AI-assisted tools can accelerate exploration when human review remains in place.
Code-First Tools
Code-first tools are best for flexible, detailed, and reproducible analysis.
Common options:
- Python: Pandas, NumPy, Matplotlib, Seaborn, Plotly, ydata-profiling
- R: ggplot2, dplyr, tidyr, base R statistics
- Notebooks: Jupyter, Databricks notebooks, cloud notebooks
Best for:
- Deep analysis
- Custom data pipelines
- Machine learning preparation
- Complex feature engineering
- Advanced statistical exploration
Business context:
- Requires skilled analytics talent
- Strong for flexibility and auditability
- Better when analysis must feed into ML or AI pipelines
Low-Code / BI Tools
Low-code and BI tools are useful when business teams need faster access to recurring analysis.
Common options:
- Power BI
- Tableau
- Looker
- Metabase
- ThoughtSpot
- Mode
Best for:
- Recurring dashboards
- Department-level analytics
- Trend monitoring
- Self-service reporting
- Stakeholder communication
Business context:
- Faster time-to-insight
- Easier adoption for non-technical users
- Less flexible than code-first workflows
- Requires strong metric definitions and data governance
AI-Augmented EDA
AI-augmented EDA is an emerging layer in modern analytics.
Examples include:
- Natural language querying
- Automated anomaly detection
- Automated correlation discovery
- Auto-generated visual summaries
- AI-assisted data preparation
- AutoML feature profiling
Common platforms include:
- Databricks
- Amazon SageMaker Canvas
- Google Vertex AI
- Microsoft Fabric and Power BI Copilot
- Cloud data platforms with built-in AI assistance
Business impact:
- Reduces manual exploration time
- Makes analytics more accessible
- Helps business users ask questions in natural language
- Supports faster hypothesis generation
However, AI-assisted EDA still needs human review. AI can surface a pattern, but it cannot fully understand commercial context, margin trade-offs, regulatory risk, customer intent, or operational constraints without human interpretation.
Tool Selection Framework
| Scenario | Recommended Tool Type |
Why |
| One-off deep analysis | Python or R |
Highest flexibility and control |
|
Recurring business dashboard |
Power BI, Tableau, Looker |
Strong for repeated reporting and stakeholder use |
|
Enterprise data lake and ML pipeline |
Databricks, cloud ML platforms | Better for scalable data processing and model preparation |
| Business team self-service | AI-augmented BI tools |
Faster exploration through natural language and automation |
|
Regulated or high-risk analysis |
Code-first plus governed data platform | Stronger auditability, version control, and lineage |
| eCommerce performance monitoring | BI plus code-first EDA |
Dashboards show trends; EDA explains root causes |
The practical approach for many enterprises is hybrid: BI tools for business visibility, code-first tools for deep analysis, and AI-augmented tools for faster exploration.
Exploratory vs. Predictive Data Analytics: Understanding the Relationship
Exploratory data analytics and predictive data analytics are not competitors. They are sequential steps in the analytics lifecycle. EDA helps businesses understand what happened and why it may have happened. Predictive analytics estimates what is likely to happen next.
In Kyanon Digital’s view, predictive analytics should not start until EDA has validated the data foundation. If the data is incomplete, biased, outdated, or poorly defined, predictive models may scale the wrong assumptions faster.
|
Criteria |
Exploratory Data Analytics |
Predictive Data Analytics |
|
Purpose |
Understand patterns, quality, and relationships | Forecast future outcomes |
| Timing | Before modeling |
After data quality and patterns are understood |
|
Output |
Insights, hypotheses, cleaned data, feature ideas | Predictions, probabilities, risk scores |
| Core question | “What does the data show?” |
“What is likely to happen?” |
|
Example insight |
“Customers in segment X churn at 3x the rate.” | “Customer Y has a 78% churn probability in the next 30 days.” |
| Main risk | Over-interpreting patterns as causation |
Building models on weak or biased data |
The Analytics Sequence
A reliable analytics lifecycle usually follows this path:
- Raw data
- Exploratory data analytics
- Data cleaning and validation
- Feature engineering
- Predictive model development
- Model validation
- Business action
- Continuous monitoring
Skipping EDA is like building on unstable ground. The predictive model may run, but the business may not be able to trust the results.
Getting the Analytics Sequence Right
Many enterprises move directly from raw data to AI or predictive analytics. This often leads to models that perform poorly on real business data because the foundation was not properly examined.
A more reliable path is:
- Start with the business decision.
- Explore the available data.
- Validate data quality and context.
- Identify patterns and risks.
- Decide whether predictive modeling is justified.
- Build models only after the data is understood.
EDA Is the Quality Gate for Business Analytics
For Kyanon Digital, exploratory data analytics is the quality gate between raw data and trusted business value. If the data cannot support reliable analysis, the next step should not be more dashboards or more AI. The next step should be better data understanding.
The shift in 2026 is clear: AI tools are making EDA faster, more automated, and more accessible. But the most important skill has not changed. Businesses still need to ask the right questions, understand the data context, and validate whether patterns are commercially meaningful.
If your business is building or upgrading its data analytics capability, Kyanon Digital can help assess your current data pipeline, embed exploratory data analytics into your workflow, and design a practical path from raw data to decision-ready insight.
Contact Kyanon Digital to discuss your data analytics roadmap!


")


 Create project brief with AI