


Real-time data analytics helps enterprises prevent supply chain disruptions by monitoring inventory, shipments, supplier performance, and operational risks using continuously updated data. Through predictive analytics, automated alerts, and scenario planning, businesses can detect emerging issues, anticipate shortages, and respond before delays spread across operations. Its effectiveness depends on reliable data integration and timely operational decisions.
For manufacturing, retail, and logistics enterprises, the challenge is often not a lack of data but the inability to act on it quickly enough. Fragmented ERP, warehouse, and transportation systems can prevent teams from identifying risks until production or deliveries are already affected.
According to BSI’s 2026 global supply chain resilience research, 38% of surveyed organizations identified insufficient timely and accurate data as a barrier to responding effectively to supply chain threats. This highlights why visibility alone is insufficient without coordinated action.
As an enterprise digital transformation and data analytics partner, Kyanon Digital helps businesses connect operational systems, establish reliable data foundations, and turn analytics into actionable business insights. This guide explores how enterprises can evaluate and implement real-time supply chain analytics to improve resilience and operational performance.
Key takeaways
- Prioritize high-cost disruptions: Invest in real-time analytics where supplier failures, inventory shortages, or delivery delays create measurable financial losses.`
- Choose the right analytics approach: Use real-time control towers for visibility and human-led decisions; consider prescriptive automation when workflows are repeatable and integration risks are manageable.
- Validate integration readiness: Kyanon Digital recommends assessing ERP, WMS, TMS, and supplier connectivity before investing in advanced analytics or custom streaming infrastructure.
- Start small before scaling: Pilot one high-impact workflow, track disruption detection, recovery time, and avoided costs, then expand based on verified outcomes.
- Build on proven data integration expertise: Kyanon Digital’s port and logistics Data Hub project demonstrates experience connecting fragmented operational data and improving reporting visibility.
Further reading:
- Logistics Data at Source: Why Input Quality Matters
- How Can Supply Chain Analytics Scale Singapore Business?
- Logistics Automation with AI: What Works in 2026
How does real-time data analytics help enterprises prevent supply chain disruptions?
Real-time data analytics helps enterprises prevent supply chain disruptions by detecting operational exceptions early, assessing their potential impact, and enabling corrective action before losses escalate. However, its business value depends on how effectively teams can respond, not simply how quickly data is processed.

Turn early warnings into corrective actions
A practical disruption-prevention workflow involves three capabilities:
- Detect: Monitor operational events and identify unusual changes in shipments, inventory, or supplier performance.
- Assess: Evaluate the potential impact on production continuity, delivery commitments, and operating costs.
- Respond: Trigger alerts, recommend corrective actions, or initiate approved operational workflows.
For example, detecting a delayed critical component shipment is valuable only when procurement teams can secure alternative supply or adjust production plans before downtime occurs.
Choose the right level of operational response
| Approach | Best suited for |
Main trade-off |
|
Real-time control tower |
Complex disruptions requiring human judgment | Response depends on operator availability and decisions |
| Prescriptive automation | Repeatable decisions with clear operating rules |
Requires stronger integration, governance, and testing |
Decision point: Begin with human-led response when operational data or approval workflows are immature. Introduce automation when actions are repeatable, authorized, and sufficiently reliable.
Quantify the financial value of disruption prevention
Evaluate potential avoided costs against the investment required.
Illustrative supplier shortage scenario:
|
Financial factor |
Reactive approach |
Early intervention |
|
Operational impact |
Production downtime | Alternative supplier activated |
| Disruption cost | S$150,000 |
S$20,000 |
|
Potential avoided cost |
— |
S$130,000 |
Hypothetical scenario, not a verified project result. Figures exclude analytics implementation and operating costs.
The investment case should account for disruption probability, intervention effectiveness, and total cost of ownership.
Investment decision: Prioritize real-time analytics where earlier intervention can realistically reduce financial losses enough to justify the solution’s lifecycle costs.

What are real-time data analytics examples in supply chain operations?
Real-time data analytics helps enterprises address shipment delays, inventory shortages, warehouse bottlenecks, and supplier disruptions before they result in significant financial losses. The right use case depends on the operational problem, available data, and whether faster insights can trigger effective corrective actions.

Logistics and fleet management
Business challenge: Unexpected transport delays, limited shipment visibility, and temperature-sensitive cargo losses.
Practical applications:
- Dynamic ETA monitoring: Combine GPS, carrier, and traffic data to identify delays and recommend alternative routes.
- Cold-chain alerts: Use IoT sensors to detect temperature deviations and notify operators before cargo is damaged.
Readiness requirement: Reliable carrier data, GPS or IoT coverage, and defined logistics escalation procedures.
KPIs: On-time delivery, delay-related costs, and inventory write-offs.
Warehouse and inventory operations
Business challenge: Stockouts, excess inventory, and inefficient fulfillment due to delayed or inconsistent stock information.
Practical applications:
- Inventory monitoring: Connect POS, e-commerce, and WMS data to identify demand spikes and adjust replenishment priorities.
- Warehouse optimization: Use operational event data or RFID to prioritize urgent orders and improve cross-docking decisions.
Readiness requirement: Accurate inventory records, synchronized systems, and reliable warehouse transaction data.
KPIs: Stockout rate, inventory carrying costs, and order processing time.
Sourcing and supplier risk management
Business challenge: Unpredictable supplier lead times and critical material shortages that threaten production continuity.
Practical applications:
- Supplier risk monitoring: Combine delivery performance with relevant external risk signals to identify emerging disruptions.
- Lead-time analysis: Detect changes in supplier reliability and recommend procurement or safety-stock adjustments.
Readiness requirement: Reliable procurement and supplier performance data, plus feasible alternative sourcing or contingency plans.
KPIs: Supplier on-time delivery, lead-time variability, and disruption-related downtime.
Use-case selection: Start with the workflow that combines high avoidable financial losses, sufficient data readiness, and actionable intervention options. If those conditions are missing, improve operational data and response processes before introducing advanced analytics.
How should enterprises evaluate real-time data analytics tools?
Enterprises should evaluate real-time data analytics tools based on system compatibility, operational requirements, scalability, governance, and total cost of ownership. A suitable platform must support timely decisions without introducing unnecessary integration complexity or long-term costs.
| Evaluation criteria |
What enterprises should verify |
|
Integration compatibility |
Connections to existing ERP, WMS, TMS, supplier, and 3PL systems |
| Data latency |
Whether streaming, near-real-time, or scheduled updates meet operational requirements |
|
Analytics capabilities |
Exception alerts, forecasting, predictive models, and decision support |
| Scalability |
Capacity to support growing transactions, facilities, and partner networks |
|
Security and governance |
Access controls, audit trails, approval workflows, and recovery procedures |
| Total cost of ownership |
Licensing, data ingestion, integration, infrastructure, and maintenance |
Off-the-shelf vs. custom analytics: Which is the better fit?

- Off-the-shelf platforms: Suitable for standard supply chain workflows when existing features and connectors meet operational requirements. Evaluate customization limitations and vendor dependency.
- Custom analytics solutions: More appropriate for specialized processes, complex legacy integrations, or proprietary operational requirements. Evaluate engineering capacity and ongoing maintenance responsibilities.
What should enterprises request before vendor selection?
Ask shortlisted vendors to demonstrate:

- Integration feasibility: Can the solution connect with your actual enterprise systems and external partners?
- Operational performance: Can it process representative data, prioritize critical exceptions, and meet required response times?
- Cost transparency: How will licensing, data volume, implementation, and maintenance affect long-term costs?
Vendor selection recommendation: Require a proof of concept using representative operational data and predefined acceptance criteria before committing to enterprise-wide deployment.
How can enterprises implement real-time data analytics to enhance supply chain efficiency?
Enterprises should implement real-time supply chain analytics through a phased approach, starting with operational risks, validating data integration, selecting the right architecture, and measuring business value before scaling. The goal is not to replace existing systems but to ensure timely insights lead to effective operational decisions.
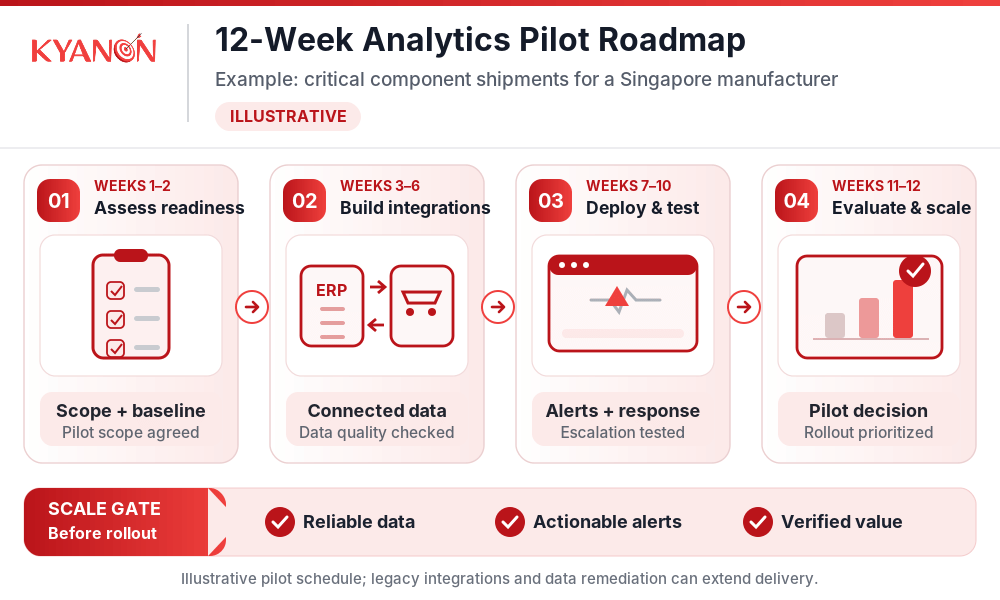
Recommended implementation roadmap
|
Phase |
Indicative timeline | Key activities |
Expected deliverable |
|
1. Assess readiness |
Weeks 1–2 | Confirm priority use case, data sources, baseline KPIs, and operational owners | Defined pilot scope and readiness assessment |
| 2. Build integrations | Weeks 3–6 | Configure data connections, quality controls, and required analytics infrastructure |
Integrated pilot data environment |
|
3. Deploy and test |
Weeks 7–10 | Configure dashboards, alerts, and response workflows; test with operational users | Working pilot with validated alerts and escalation procedures |
| 4. Evaluate and scale | Weeks 11–12 | Compare results against baselines, assess costs and adoption, and define expansion priorities |
Pilot evaluation and phased rollout plan |
When should enterprises move beyond the pilot?
Enterprise-wide rollout should proceed only when the pilot demonstrates:
- Reliable data: Critical operational events are captured accurately and consistently.
- Effective responses: Teams can act on alerts within required decision windows.
- Measurable value: Operational and financial improvements justify further investment.
Implementation recommendation: Expand gradually across additional suppliers, warehouses, or logistics networks. Address data quality, integration, and adoption gaps before automating high-impact decisions.
Timeline note: This 12-week roadmap is an illustrative planning scenario for a limited-scope pilot, not a guaranteed delivery schedule. Complex legacy integrations, external partner dependencies, and data remediation can extend implementation.
How Kyanon Digital helps enterprises build data-driven supply chains
Kyanon Digital supports enterprises in connecting fragmented operational data, building scalable analytics foundations, and integrating insights into supply chain decisions.

Through our Supply Chain & Fulfillment Solutions, we support:
- Enterprise data integration: Connect ERP, warehouse, transportation, and operational systems.
- Real-time operational visibility: Build data hubs, BI dashboards, and performance-monitoring capabilities.
- Predictive analytics: Support forecasting, exception identification, and decision intelligence.
- Workflow integration: Connect analytics with operational reporting and business processes.
How Kyanon Digital built a data hub and BI analytics platform for a major port and logistics operator
Kyanon Digital partnered with a major Vietnamese port and logistics operator to improve data accessibility, reporting, and operational visibility across a complex logistics environment.
How Kyanon Digital built a data hub and BI analytics platform for a major port and logistics operator.
Challenges
- Fragmented operational information across multiple systems and departments.
- Manual reporting processes that delayed access to critical information.
- Inconsistent data and limited enterprise-wide visibility.
Solution from Kyanon Digital
- Developed a centralized Data Hub supporting real-time data integration.
- Established standardized data structures and a reference data catalog.
- Implemented Power BI dashboards and AI-driven analytics for operational reporting.
Results and Impact
- Improved operational data accessibility and integration reliability.
- Reduced manual reporting effort and data inconsistencies.
- Enabled more timely, centralized performance monitoring and decision-making.
These outcomes demonstrate the value of an integrated analytics foundation. However, the published case does not establish a quantified reduction in supply chain disruptions, so such an outcome should be validated separately.
Explore the full Kyanon Digital Data Hub & BI Analytics for Port and Logistics case study.
Conclusion
Real-time data analytics helps prevent supply chain disruptions when timely insights translate into effective operational actions. For enterprises evaluating solutions, the priority is not the most advanced technology but the right combination of data integration, actionable alerts, and measurable business value. Before investing, assess your existing systems, identify the disruptions with the greatest financial impact, and validate a focused use case. Scale only when improvements in delivery reliability, inventory availability, or disruption recovery justify total investment costs.
Looking to strengthen supply chain resilience? Discuss your supply chain analytics roadmap with Kyanon Digital to assess integration readiness, prioritize high-value use cases, and define a practical implementation scope.
References
- Logistics Industry Overview — Enterprise Singapore, 2026.
- Data, Analytics & Business Intelligence — Kyanon Digital.
- Supply Chain & Fulfillment — Kyanon Digital.
- Data Hub & BI Analytics for Vietnam’s Largest Port & Logistics Operator — Kyanon Digital.








 Create project brief with AI