

A modern warehouse, lakehouse or data hub pays off when it delivers the facts a business needs before the decision window closes. For manufacturers and distributors, that means connecting production, stock, orders and distributor signals around one specific action.
By Rosy Giang Tran, Consulting Practice Lead, Kyanon Digital – Digital Consulting, Data, BI & AI
Key takeaways
- Scope the platform with a decision contract before anyone designs a pipeline.
- Keep three clocks: event time, availability time and decision time. A freshly refreshed dashboard can still show an old fact.
- The first deliverable is one governed data product at SKU × location × day. It is not a lake holding every table you own.
Last week, a household-products manufacturer met its production plan while its one-litre floor cleaner ran out in Hanoi, and HCMC sat on two weeks of stock. By Friday the team understood what had happened. On Tuesday, when it could still have acted, the facts were scattered.
So this week’s question is concrete. If the shortage could have been prevented on Tuesday, what would the business have needed to know, and trust, on Tuesday?
Most platform programs start with an inventory of systems and a target architecture. That is how a company ends up consolidating every table into a new platform and still discovering the shortage on Friday. A decision-led platform works the other way round. It starts from the decisions that create value and builds reusable data capabilities around the information, timing and accountability those decisions need.
Four systems, four versions of “available”
On Wednesday morning the planner opens five screens. ERP shows a completed batch. The warehouse system shows it at the central warehouse. The quality system has not released all of it. Order management shows part of it already promised. The Hanoi distributor’s file, which arrived last Friday, describes stock counted the Tuesday before.
Each system is right for its own purpose. They disagree as soon as someone asks a question that crosses their boundaries. The platform has to reconcile four kinds of meaning:
- Product and place. Is the distributor’s “Nước lau sàn 1L” the same sellable unit as the plant’s CLN-1L? Is a carton of twelve being compared with single bottles?
- Status and rights. Was the batch completed, released, received, left uncommitted, and owned by someone who can move it?
- Time. When did the event happen, when was it recorded, and when did we receive it?
- Commercial context. Is a spike in distributor orders real sell-out, a promotion build or catch-up after an earlier stockout?
Without these distinctions, a single “inventory” number looks more precise than it is. A polished dashboard, and later an AI model, will repeat the error faster and more convincingly.
Exhibit 1 – One SKU, four versions of “available”
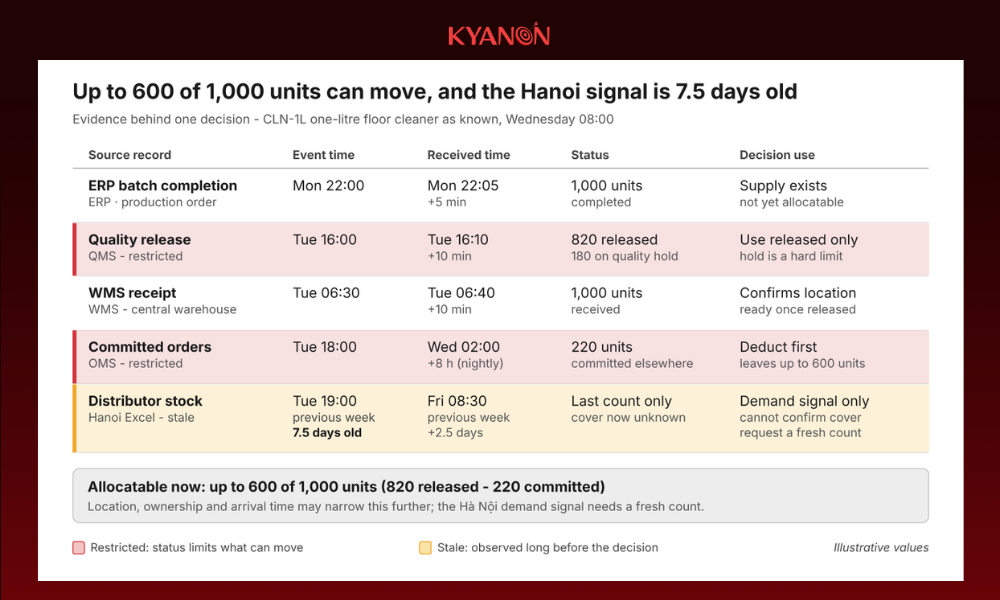
Two records restrict the answer and one is stale. The quality hold and existing commitments cut 1,000 recorded units to at most 600, and the only Hanoi observation is more than a week old.

Start with a decision contract
Before specifying pipelines, agree a one-page decision contract with sales, supply planning, manufacturing, quality and distribution. For the shortage decision, it could read:
|
Element |
What the business agrees |
|---|---|
| Decision |
Spot a credible regional shortage early enough to change allocation, a transfer or the next production mix |
|
Owner |
Supply planning recommends; commercial and operations approve within defined thresholds |
| Grain |
Product and pack size × location or channel × day, with batch and ownership detail where an action needs it |
|
Evidence |
Released and uncommitted stock; confirmed orders; goods in transit; production and quality status; distributor stock and sell-out where available |
| Freshness |
A stated expectation for each feed, tied to the action window; every view shows the latest observation and whether it is stale |
|
Exceptions |
Missing distributor data stays “unknown”; ambiguous product mappings go to a named resolution queue |
| Outcome |
Record who chose which response and when, and its effect on stockout days, service level and avoidable cost |
The contract prevents a common failure: a technically successful platform that delivers a correct weekly picture when the decision had to be made daily. It also separates the problems that need faster integration from those that need better definitions, clearer authority or a different agreement with distributors.
Freshness deserves the most care. A distributor that sends an Excel stock file once a week cannot support a daily inventory claim. The options are to integrate with the distributor’s DMS, negotiate more frequent reporting, use other signals with their uncertainty clearly stated, or run the decision at a cadence the evidence can support. Calling the data “real time” does not change when it is observed.
Three clocks keep a platform honest
Most platforms record when a row is loaded. A shortage decision needs three clocks:
- Event time: when stock was counted, a batch released, a product sold or a truck dispatched.
- Availability time: when that fact reached us and entered a trusted view.
- Decision time: the last moment an allocation, transfer or production change could still reach the shelf.
The Hanoi distributor counted stock on Tuesday evening and uploaded the file on Friday morning. A dashboard refreshed on Friday will show a Tuesday fact. If the pipeline overwrites the old value without keeping both timestamps, the business loses the ability to measure that delay, or to reconstruct what decision makers actually knew at the time.
Keeping history “as known then” matters twice. It lets the business measure its decision latency. Later, it stops AI models from learning from information that was not available when the decision was made. GS1’s EPCIS standard is a useful reference for modelling these events (what happened, when, where and in what business context), even when the first release runs on existing ERP, WMS and distributor feeds.
Exhibit 2 – Three clocks, one decision window
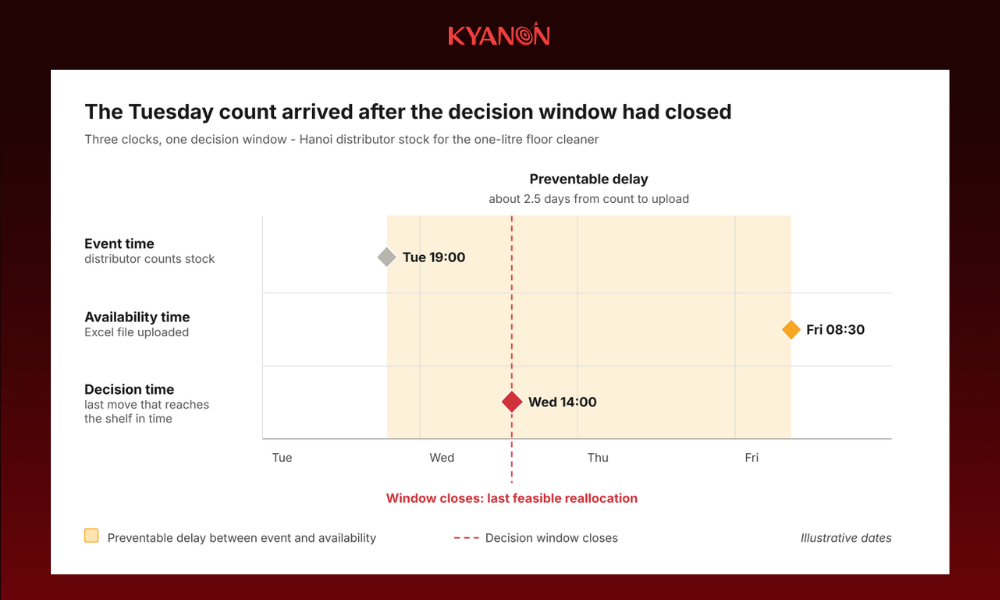
The stock was counted on Tuesday evening and the last useful move was due on Wednesday, but the file arrived only on Friday. A dashboard refreshed on Friday would still show a Tuesday fact.
Warehouse, lakehouse or data hub? Let the contract decide
With the contract agreed, the architecture follows. The first release connects ERP production and orders, quality status, warehouse movements, shipments and distributor stock and sell-out. Data moves through five stages:
- Capture source evidence. Keep original records, timestamps and corrections so any figure can be traced back to its source.
- Standardise shared entities. Map product codes, pack sizes, units, locations, distributors and dates. Version the mappings when they change.
- Reconcile business events. Separate produced, released, received, reserved, dispatched, in-transit, partner-held and sold quantities. Apply ownership and allocation rights explicitly.
- Publish a governed data product. Deliver the SKU × location × day view with its measures, lineage, freshness, quality status and access rules.
- Capture decisions and results. Record alerts, approvals and actions so the business can learn whether earlier information changed the outcome.
The choice of technology depends on your current estate, data volumes and operating constraints. A data warehouse suits curated analytical models and controlled reporting. A lakehouse suits large, varied event histories and model development. A data hub suits exchanging data and reference data between applications. These patterns can coexist. What makes a planner trust the output is the set of business rules and contracts that travel through them.
Let the decision window set the integration speed. Scheduled batch loads are fine where the window allows. Event or API integration is worth it only for signals that change an action within the day. For an allocation decision, a quality-release event is worth far more than a stream of machine sensor readings.
Build operational controls from the start. Monitor whether distributor files arrived, flag failed product mappings, route exceptions to named data stewards, and show users the age and coverage of every metric. Apply access control to commercial and partner data.
Exhibit 3 – Reference architecture, from evidence to action
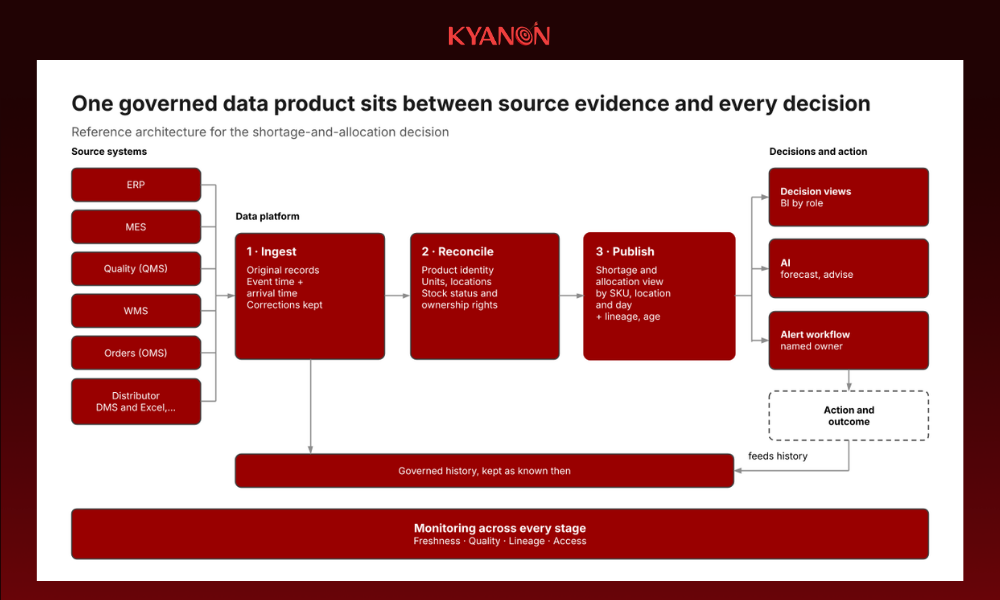
Six sources feed one governed data product, which serves decision views, alerts and later AI. Every action and its outcome flows back into history, and monitoring covers every stage.
Unknown is not zero
No manufacturer gets perfect distributor data on day one. A good data product separates what is known, what is estimated and what is missing. A Hanoi risk card might show the last confirmed stock count and its date, orders placed since then, a stock-cover range with its assumptions, and a warning that the distributor file is late. A single precise-looking number without that warning would hide exactly the uncertainty the planner needs to manage.
Client story: governing data across Vietnam’s largest port and logistics network
The operator of Vietnam’s largest port and logistics network faced a familiar set of problems. Data was fragmented across operational systems, reporting was manual, data standards were inconsistent, and there was no central governance. Leaders had limited visibility into operations, finance and HR.
We built a Data Hub with a reference-data catalog, Power BI dashboards across operational and management domains, and embedded AI models on top of the governed foundation.
The parallel for manufacturers is direct. A port, like a factory-to-market network, is a chain of hand-offs between systems and organisations. Governing reference data comes before dashboards.
We saw the same principle in a forestry-products trade-data program across Vietnam and India. There, a unified data model and standardised classifications had to be in place before Power BI comparisons across markets could be trusted.
Prove one decision, then reuse the platform
Reconstruct a recent shortage and baseline the three clocks. Build the first data product for one product family and one distributor network. Put its freshness and quality indicators in front of the people who make allocation decisions. Then track three levels:
|
Level |
Measures | Why it matters |
|---|---|---|
| Data reliability | Feed arrival, mapped-SKU coverage, reconciliation exceptions, observation age |
Is the answer complete and timely enough to use? |
|
Decision performance |
Time to detect, reconcile, approve and execute | Where is the decision window gained or lost? |
| Business outcome | Stockout days, service level, expedited freight, excess stock |
Did faster decisions create economic value? |
Once the first product proves itself, reuse its product and location identities, pipeline monitoring, security policies and shared measures for the next decisions: replenishment, production planning, distributor performance and, eventually, demand sensing. Reuse gives the platform scale. The first decision gives it direction.
How we help. Our Data Strategy & Governance and Warehousing & Analytics teams help you define the decision contract, design and build pipelines and a governed warehouse, lakehouse or data hub that fits your current ERP, DMS and WMS estate, and prepare the history that later BI and AI will depend on. Explore our Data, Analytics & BI services.
Your next step: a data platform readiness assessment. Bring one recent shortage, the relevant source extracts and the people who owned the response. We define the decision contract, scope the minimum viable data product, and outline a reference architecture and roadmap. Talk to our data team
See the change, trust the evidence, choose within constraints, act in time, learn from the result.
Next week: “When Factory KPIs Improve but Customer Service Gets Worse” – How BI turns a trusted data product into shared measures and an accountable allocation decision.
The manufacturer, shortage and figures in this article are illustrative. Client stories are separate published engagements.







 Create project brief with AI