

A manufacturer can hit its production plan, ship every order on time, and still lose sales to a regional stockout. A missing dashboard is not the problem. The problem is the time that passes between a change in the market and a decision the business can act on.
By Rosy Giang Tran, Consulting Practice Lead, Kyanon Digital – Digital Consulting, Data, BI & AI
Key takeaways
- Green factory KPIs and a regional stockout can both be true. They measure different points in the same chain.
- The cost that matters is decision latency: the time needed to detect, understand, decide and execute before the shelf is empty.
- A request for a data platform is usually a decision problem underneath. Name the decision first.
This year, several manufacturers and distributors have come to us asking for the same thing: a modern data platform. They want a data warehouse, automated pipelines, Power BI, and something “ready for AI.” When we ask which decision the platform should improve, the conversation changes. It almost always arrives at a Monday meeting like this one.
The operations review opens on good news. Production is on plan. The warehouse dispatched orders on time. Total finished-goods stock is within target. Then the commercial director reports that the company’s fast-moving one-litre floor cleaner was missing from general-trade shelves across Hanoi all weekend. Meanwhile, the HCMC distributor is sitting on two weeks of the same product.
All four statements are true. The factory knows what it made. The warehouse knows what it shipped. Finance knows what the stock is worth. None of them can answer the question that matters to the shopper who left empty-handed:was usable stock in the right place while there was still time to move it?
Exhibit 1 – All four views can be true
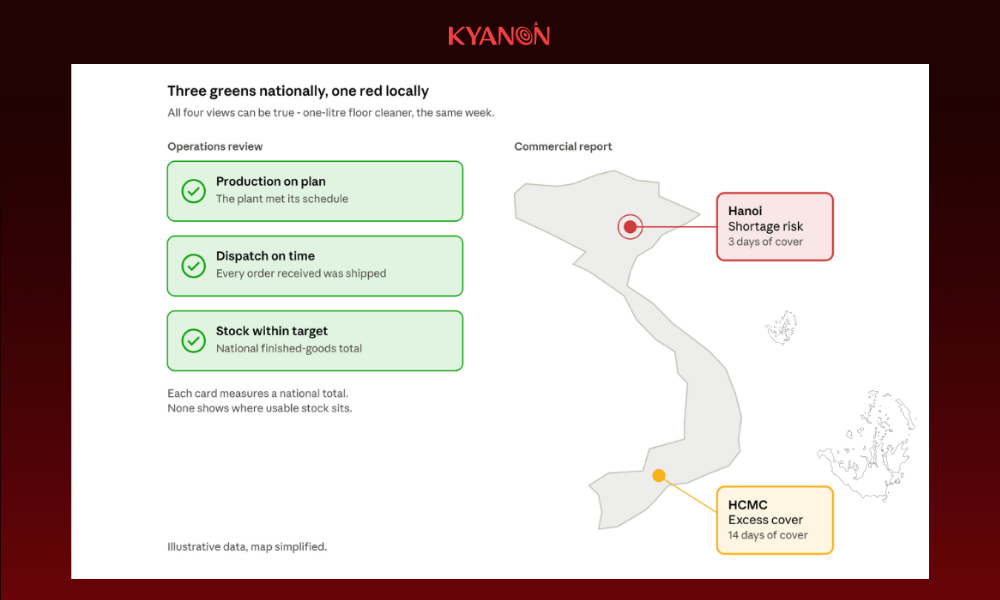
Every national indicator is green, yet the same product has 3 days of cover in Hanoi and 14 in HCMC.
One product, two regions, one lost week
Take an illustrative household-products manufacturer selling through regional distributors into general trade. A local promotion lifts demand in the North. By Tuesday, the Hanoi distributor has about three days of stock cover. The HCMC distributor has about fourteen. The plant has met its schedule.
The facts needed to see the problem sit in different places:
- The Hanoi distributor’s stock report arrives as an Excel file on Friday.
- The HCMC distributor’s DMS uses its own product code and counts cartons, not bottles.
- The newest batch is included in the finished-goods total, but part of it is still on quality hold.
- The next production run was planned against last month’s demand.
By Friday, the planning team can explain what happened. On Tuesday, it still had choices. It could reallocate released, company-owned stock from the central warehouse. It could ask the HCMC distributor to transfer partner-owned stock. It could change the mix of the next batch. Each option has its own lead time, cost and decision owner. A Friday report explains the shortage but can no longer prevent it.

The clock that matters starts before the report
We call the time between a material change in the market and an effective response decision latency. It has four stages:
- Detect. How soon does a change in demand or stock cover become visible?
- Understand. How long does it take to reconcile products, locations, ownership, quality status and commitments?
- Decide. Who weighs the options and approves the exception?
- Execute. When does the decision actually change a shipment, a transfer or a production plan?
Each stage calls for a different fix. If three days disappear while teams reconcile distributor files, the bottleneck is integration and shared definitions. If a trusted signal exists on Tuesday but the allocation meeting happens on Friday, the fix is the operating rhythm, not the refresh rate. If an approved transfer takes five days to arrive, the answer lies in replenishment policy or the production mix. “Real time” is not the default answer. The decision window is.
Exhibit 2 – Where the week was lost
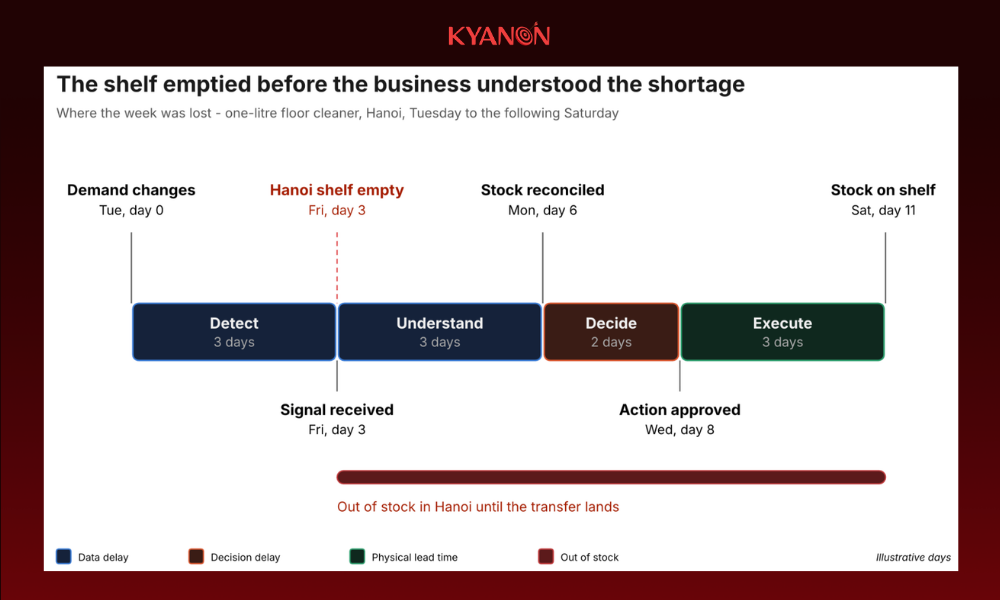
The Hanoi shelf ran empty on day 3, the day the first signal arrived. Six of the eleven days were lost to data delay before a decision was even possible.
“Inventory” needs a business meaning before it feeds a dashboard, or an AI model
Suppose the central system shows 1,000 units. If 180 are on quality hold and 220 are already committed to other customers, at most 600 can be allocated. Location, ownership, transit time and batch rules may shrink that number further. A dashboard showing “1,000 available” creates confidence at exactly the wrong moment.
Demand needs the same care. Shipments show what the manufacturer sent to a distributor, not what shoppers bought. Distributor orders mix real consumption with promotion builds and catch-up after earlier shortages. Above all, zero sales during a stockout do not mean zero demand. A forecasting model trained without that distinction learns to expect less demand in exactly the places where the company failed to supply. This is why AI readiness starts much earlier than most AI projects do.
Exhibit 3 – From recorded to usable stock
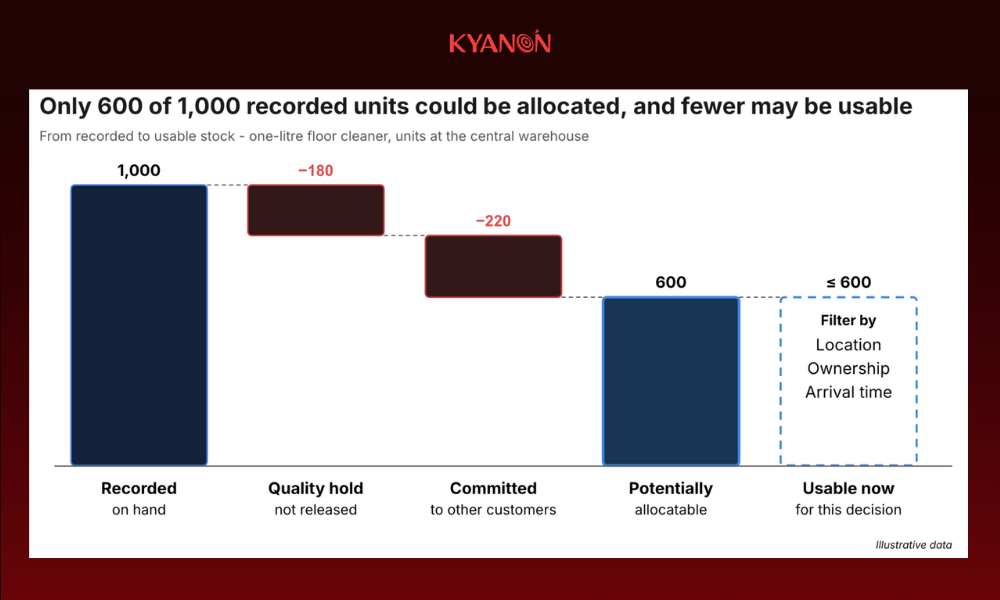
Quality hold and existing commitments remove 400 of the 1,000 recorded units. Location, ownership and arrival time then decide how much of the remaining 600 can reach Hanoi in time.
The question behind a data platform request
The requests we receive are usually written in technology terms. The value appears once leadership names the decision behind them. For a shortage like this one, the platform, BI and AI together must answer four questions:
Question | The fact the team needs | What a conventional report misses |
|---|---|---|
| Where did demand change? | Recent sell-out, orders, promotions, local stock cover | Shipments record what moved, not what could have sold |
Where is usable stock? | Quantity by product, location, quality status, commitment, owner | A total may include held, reserved or partner-owned units |
| What can arrive in time? | Transit, production, release and replenishment lead times | A batch that exists on paper may arrive after the shortage |
Who can authorise action? | Allocation rights, partner agreements, escalation owner | Seeing the stock does not grant permission to move it |
The next three articles in this series take these questions in turn. Week 2 covers the data platform that answers them reliably. Week 3 covers the BI that turns the answers into a decision. Week 4 covers the AI that makes the decision earlier and better.
Start with a replay, not a requirements list
The strongest investment case starts with one decision that leadership can name. Pick one product family, one region and one recent shortage. Then reconstruct it: when demand changed, when the business learned of it, which stock was truly usable, who could authorise each response, and when an action could have reached the shelf. Measure how many days each of the four stages consumed.
That replay does two jobs. It tells you which data sources, definitions and pipelines the platform must govern first. It also sets the baseline against which every later investment in BI and AI can be judged.
How we help. Kyanon Digital’s Data & BI practice works with commercial, supply chain, operations and IT teams to turn a decision like this into a data roadmap. The work runs from data strategy and governance through warehousing, pipelines and BI to AI. Explore our Data, Analytics & BI services.
Your next step: a shortage replay session. Bring one recent stockout and the people who handled it. In a half-day working session, we map the decision timeline, show where the days were lost, and identify the first data product worth building. Book a session with our team.
See the change, trust the evidence, choose within constraints, act in time, learn from the result.
Next week: “The Data Platform Should Follow the Flow of Decisions” – How to design a warehouse, pipelines and data products around the moment a decision must be made.
The manufacturer, products and figures in this article are illustrative, based on patterns we see across client engagements.









 Create project brief with AI